Saturday, December 21, 2013

Percent Of Labor Force On Extended Unemployment Benefits By State: Chart

From The Wall Street Journal, Real Time Economics, "Without Unemployment Extension, Which States Would Be Hit Hardest?" by Jeffrey Sparshott:

Alabama
12,325
2,131,015
0.58%
Alaska
5,424
365,014
1.49%
Arizona
14,775
2,996,083
0.49%
Arkansas
9,138
1,321,491
0.69%
California
253,465
18,605,923
1.36%
Colorado
17,907
2,747,235
0.65%
Connecticut
25,175
1,853,755
1.36%
Delaware
3,773
439,375
0.86%
Dist Columbia
4,588
362,532
1.27%
Florida
36,372
9,395,625
0.39%
Georgia
66,729
4,761,141
1.40%
Hawaii
2,044
648,307
0.32%
Idaho
2,591
772,553
0.34%
Illinois
79,201
6,519,135
1.21%
Indiana
19,334
3,157,064
0.61%
Iowa
4,902
1,659,180
0.30%
Kansas
4,647
1,487,990
0.31%
Kentucky
18,600
2,063,809
0.90%
Louisiana
6,837
2,085,288
0.33%
Maine
3,334
709,874
0.47%
Maryland
28,881
3,113,857
0.93%
Massachusetts
55,048
3,487,578
1.58%
Michigan
47,013
4,724,597
1.00%
Minnesota
11,314
2,964,572
0.38%
Mississippi
12,005
1,283,201
0.94%
Missouri
25,105
3,012,543
0.83%
Montana
1,981
508,310
0.39%
Nebraska
2,026
1,027,092
0.20%
Nevada
16,746
1,362,268
1.23%
New Hampshire
1,316
741,735
0.18%
New Jersey
84,048
4,562,290
1.84%
New Mexico
6,011
920,734
0.65%
New York
128,543
9,655,028
1.33%
North Carolina
0
4,665,909
0.00%
North Dakota
628
401,108
0.16%
Ohio
38,348
5,727,339
0.67%
Oklahoma
4,497
1,812,689
0.25%
Oregon
20,896
1,918,736
1.09%
Pennsylvania
86,434
6,471,380
1.34%
Rhode Island
4,907
550,711
0.89%
South Carolina
14,916
2,156,962
0.69%
South Dakota
302
449,448
0.07%
Tennessee
18,405
3,076,053
0.60%
Texas
70,176
12,787,775
0.55%
Utah
2,931
1,408,453
0.21%
Vermont
706
351,626
0.20%
Virginia
10,074
4,222,048
0.24%
Washington
23,101
3,470,611
0.67%
West Virginia
6,622
795,424
0.83%
Wisconsin
25,327
3,064,739
0.83%
Wyoming
841
306,640
0.27%

Source: Labor Department

Source: The Wall Street Journal

Friday, December 20, 2013

NY Times Gets It Wrong On Racial Gap In Breast Cancer Survival

The New York Times highlights a racial gap in breast cancer survival in an article, today, Dec 20, 2013, "THE CANCER DIVIDE: Tackling a Racial Gap in Breast Cancer Survival" by Tara Parker-Pope. The Times got it wrong.

The NY Times has bought into the Pink industrial complex ideology that breast cancer screening is the paramount health exam for women and that breast cancer is the most serious health threat facing women today.

Diabetes is much more serious threat in the US. Diabetes and pre-diabetic conditions amplify the effects and increase the mortality rates of other diseases. Prevention of Diabetes would do more to save women's lives from breast cancer than more screening. A recent study, published Sept 2013, shows that when ones controls for diabetic conditions there is no difference in women's mortality rates from cancer among different racial/ethnic groups despite the known differences in breast cancer screening rates among the various subgroups.

The comment I published to the New York Times article on the racial gap in breast cancer survival.
When one controls for incidence of diabetes, there is no difference in mortality cancer rates between Black women, White women or other ethnic/racial groups.

From American Journal of Epidemiology, Am. J. Epidemiol. (2013), "All-Cause, Cardiovascular, and Cancer Mortality Rates in Postmenopausal White, Black, Hispanic, and Asian Women With and Without Diabetes in the United States
The Women's Health Initiative, 1993–2009
" First published online: September 17, 2013:

"To our knowledge, the present study is the first to show that hazard ratios for mortality outcomes were not significantly different between racial/ethnic subgroups when stratified by diabetes status. Because of the “amplifying” effect of diabetes prevalence, efforts to reduce racial/ethnic disparities in the rate of death from diabetes should focus on prevention of diabetes."

http://aje.oxfordjournals.org/content/early/2013/09/17/aje.kwt177.abstract

Blacks are almost twice as likely to have diabetes as Whites. American Diabetes Assoc.

http://www.diabetes.org/living-with-diabetes/complications/african-americans-and-complications.html

One In Five International Migrants Come To US: Up From One In Six In 1990

From PewResearch, "Changing Patterns of Global Migration and Remittances: More Migrants in U.S. and Other Wealthy Countries; More Money to Middle-Income Countries" by Phillip Connor, D’vera Cohn And Ana Gonzalez-Barrera:
A rising share of international migrants now lives in today’s high-income countries such as the United States and Germany, while a growing share was born in today’s middle-income nations such as India and Mexico, the analysis finds.

Source: Pew Research Center
These shifts occurred as the total number of international migrants rose from 154 million in 1990 to 232 million in 2013 – but remained steady as a 3% share of the globe’s growing population.

During this period, the U.S. remained the largest destination country by far and increased its share of the world’s migrants. One-in-five (46 million) migrants now live in the U.S., compared with slightly less than one-in-six (23 million) in 1990.

US Income Inequality Decreased In 2011: No Increase In Income Inequality Since 2001 And By Some Researchers As Far Back As 1980s

From Tax Foundation, "IRS: Income Inequality Went Down in 2011" by William McBride:
The chart below indicates that the share of income accruing to the top 1 percent of earners, and the top 0.1 percent of earners, went down slightly in 2011. This despite an economic recovery that has been most evident in a booming stock market. Further, these top shares of income remain below the average for the last 10 years, and much lower than they were from 2005 to 2007.
***
The hard data indicates there has been no appreciable increase in income inequality since 2001. Other reputable studies, some of which are reviewed here, indicate income inequality has not increased since the 1980s.
Income Shares Of Rich: Graph
Source: Tax Foundation

Thursday, December 19, 2013

McKinsey & Co Global Survey Of Economic Conditions, December 2013

From McKinsey & Company, Insights & Publications, "Economic Conditions Snapshot, December 2013: McKinsey Global Survey results" December 2013:
As 2013 draws to a close, executives are more optimistic about economic improvements than they have been all year, both at home and in the global economy. They also anticipate that conditions will continue to improve, thanks to the steady (though modest) improvements in the developed world that many expect to see.

In McKinsey’s newest survey on economic conditions,1 the responses affirm that economic momentum has shifted—and will continue to move—from the developed to the developing world, as we first observed in September. Indeed, executives say the slowdown in emerging markets was one of the biggest business challenges this year, and respondents working in those markets are less sanguine than others about the current state of their home economies.
***
More positivity at home
At the country level, executives’ bullishness is steadily growing: 45 percent say economic conditions are better now than six months ago, up from 42 percent in September and 36 percent in June, though views vary across regions. Respondents in developed Asia are twice as likely as those in developing markets, for example, to say conditions have improved. [Footnotes and tables omitted]

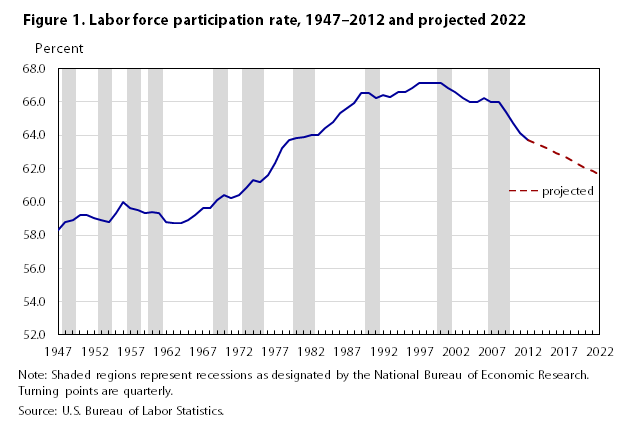
Labor Force Participation Rate Expected To Decline Over Next Decade: BLS

From Bureau of Labor Statistics, Monthly Labor Review, December 2013, "Labor force projections to 2022: the labor force participation rate continues to fall:"

Labor Force Participation Rate
Source: Bureau of Labor Statistics
***
Labor force participation rate
***
The labor force participation rate—the proportion of the civilian noninstitutional population in the labor force—is typically lower for 16-to-19-year-olds in comparison to other age groups, but it increases during the prime working years and then declines sharply after age 55 as workers leave the labor force. The labor force participation rate is a major indicator of the state of the labor market. Changes in the overall and detailed age, gender, race, and ethnic labor force participation rates are the result of a combination of factors, including changes in the demographic composition of the population as well as cyclical and structural changes in the economy. Each of these factors affects labor force participation rates in various ways. The demographic composition of a population reflects the shares of men, women, and the different age, race, and ethnic groups within that population. The aging of the baby-boom generation is an example of a demographic change affecting the labor force participation rate. In 2000, baby boomers were ages 36 to 54 and were in the prime age group, with the highest participation rates. Every year after 2000, a segment of the baby-boom population has shifted into the 55-years-and-older age group, moving from the prime age group to one with much lower participation rates, causing the overall participation rate to decrease. (See table 3 [omitted].) This trend is expected to continue and even accelerate in the 2012–2022 timeframe.

There Is Always Marketplace Competition: Fed-Ex, UPS, USPS Losing Business To Faster, Cheaper, Smaller Connected Regional Shippers

From The Wall Street Journal, "A New Threat to UPS and FedEx: Networks of 'Super Regional' Shippers Handle More Packages for E-Retailers" by Laura Stevens:
They work like this: A company such as Eastern Connection, which operates in the Northeast, picks up a package in New York City. It hands it off in Harrisburg, Pa., to another shipper, partner Pitt Ohio LLC, which delivers it a total of two days later to a customer in Columbus, Ohio.

By cobbling together networks, the regional shippers are grabbing market share from UPS, FedEx and the U.S. Postal Service as e-retailers look for cheaper, faster delivery options for their online shoppers.

Regional shippers typically can get a package between two points in one region—from New York to Boston, for example—faster than their national counterparts, and they are able to price shipments 20% to 40% below the national shippers because of their lower costs. Most regional shippers have ground-only delivery networks that employ contracted drivers who own their own company-branded vans.

"They're going into the area that UPS and FedEx pretty much dominate—and they can go further faster," said Ivan Hofmann, a former executive at FedEx Ground who now consults with regionals as part of ETC & Associates LLC. [Emphasis added.]
Of course, the one proviso is that government does not restrict competition by creating legal barriers for new business to enter and compete with the established players, as it often does under the guise of protecting the consumer.

Wednesday, December 18, 2013

NSA Spying Costing US Companies $35 Billion In Lost Revenue

From Bloomberg, "NSA Fallout Tests Obama Relationship With Tech Companies" by Margaret Talev and Chris Strohm:
For the companies, it’s a matter of the bottom line.

“They see real risk to their market share,” said James Lewis of the Center for Strategic and International Studies in Washington. “You’ve got German, Chinese even Russian companies saying ’Hey, buy from us, that way you won’t be at risk.’ It’s crazy. That’s what this has become -- an opportunity for commercial advantage as well as an uproar over privacy.”

Costing Business

Reports about U.S. spying abroad may cost U.S. companies as much as $35 billion in lost revenue through 2016 because of doubts about the security of their systems, according to the Information Technology & Innovation Foundation, a policy research group in Washington.

Continuous Industrial Process For Crude Oil From Algae In Under An Hour Created

From "Algae to crude oil: Million-year natural process takes minutes in the lab" on ScienceBlog:
Engineers have created a continuous chemical process that produces useful crude oil minutes after they pour in harvested algae — a verdant green paste with the consistency of pea soup.

The research by engineers at the Department of Energy’s Pacific Northwest National Laboratory was reported recently in the journalAlgal Research. A biofuels company, Utah-based Genifuel Corp., has licensed the technology and is working with an industrial partner to build a pilot plant using the technology.

In the PNNL process, a slurry of wet algae is pumped into the front end of a chemical reactor. Once the system is up and running, out comes crude oil in less than an hour, along with water and a byproduct stream of material containing phosphorus that can be recycled to grow more algae.
***
The products of the process are:
  • Crude oil, which can be converted to aviation fuel, gasoline or diesel fuel. In the team’s experiments, generally more than 50 percent of the algae’s carbon is converted to energy in crude oil — sometimes as much as 70 percent.
  • Clean water, which can be re-used to grow more algae.
  • Fuel gas, which can be burned to make electricity or cleaned to make natural gas for vehicle fuel in the form of compressed natural gas.
  • Nutrients such as nitrogen, phosphorus, and potassium — the key nutrients for growing algae.

Tax Evasion Does Not Cost The World Anything: The Money Is Spent

From Tim Worstall, "Apparently tax evasion destroys money these days" by Tim Worstall:
Tax evasion does not...cost the world anything. We are still a closed system. That less money goes to governments does not mean that that money ceases to exist. It still gets spent or invested somewhere or other.

Indeed, dependent upon what happens to that money, and how badly the government that didn’t get it would have spent it, tax evasion could, conceivably, result in an improvement in the human condition. But even leaving aside such an extreme (for example, someone takes the loot from tax evasion and invests it in a malaria vaccine, as opposed to the British Government which would have used £10 billion to build an NHS [National Health Service] computer system that does nothing at all) it’s still true that tax evasion does not mean a loss for the world. Only a different distribution of the cash.

US Map By State Of Top Selling Vehicles

From Business Insider, "MAP: The Best-Selling Car In Every State" by Alex Davies and Mike Nudelman:
Not surprisingly, Ford F-Series family of trucks dominated the list, coming in at number one in more than 30 states. But Americans elsewhere have different tastes: Florida and Maryland went for the Toyota Camry. Hawaii liked the Toyota Tacoma. Oklahoma bucked the geographic trend — the most popular car there is the Nissan Altima sedan.

Source:  Business Insider

Tuesday, December 17, 2013

HealthCare Prices Versus Inflation Graph:1935 To 2010

From The Circle Bastiat, "How Government Regulations Made Healthcare So Expensive" by Mises Updates, December 17th, 2013, "Guest Post: The U.S. Offers Obamacare to Those Who Don’t Remember When Markets Controlled Medical Costs" by Mike Holly:

Figure 1:  An Indexed Comparison of Health Care Inflation and Consumer Price Index in US from 1935 to 2009  (Source: US Census 2013)
Source:
The Circle Bastiat

CBO Projects Social Security Trust Fund (OASDI) Will Be Depleted In 2033: A Depleted Trust Fund Ends Legal Authority To Pay Full Benefits

From CBO, "The 2013 Long-Term Projections for Social Security: Additional Information:"
Social Security is the federal government’s largest single program. Of the 58 million people who currently receive Social Security benefits, about 70 percent are retired workers or their spouses and children, and another 11 percent are survivors of deceased workers; all of those beneficiaries receive payments through Old-Age and Survivors Insurance (OASI). The other 19 percent of beneficiaries are disabled workers or their spouses and children; they receive Disability Insurance (DI) benefits.

In fiscal year 2013, Social Security’s outlays totaled $808 billion, almost one-quarter of federal spending; OASI payments accounted for about 83 percent of those outlays, and DI payments made up about 17 percent. Each year, CBO prepares long-term projections of revenues and outlays for the program. The most recent set of 75-year projections was published in September 2013. This publication (shown below) presents additional information about those projections.


Social Security has two primary sources of tax revenues: payroll taxes and income taxes on benefits. Roughly 96 percent of those revenues derive from a payroll tax—generally, 12.4 percent of earnings—that is split evenly between workers and their employers; self-employed people pay the entire tax. The payroll tax applies only to taxable earnings—earnings up to a maximum annual amount ($113,700 in 2013). The remaining share of tax revenues—4 percent—is collected from income taxes that higher-income beneficiaries pay on their benefits. Revenues credited to the program totaled $745 billion in fiscal year 2013.
***
In calendar year 2010, for the first time since the enactment of the Social Security Amendments of 1983, annual outlays for the program exceeded annual tax revenues (that is, outlays exceeded total revenues excluding interest credited to the trust funds). In 2012, outlays exceeded noninterest income by about 7 percent, and CBO projects that the gap will average about 12 percent of tax revenues over the next decade. As more members of the baby-boom generation retire, outlays will increase relative to the size of the economy, whereas tax revenues will remain at an almost constant share of the economy. As a result, the gap will grow larger in the 2020s and will exceed 30 percent of revenues by 2030.

CBO projects that under current law, the DI trust fund will be exhausted in fiscal year 2017, and the OASI trust fund will be exhausted in 2033. If a trust fund’s balance fell to zero and current revenues were insufficient to cover the benefits specified in law, the Social Security Administration would no longer have legal authority to pay full benefits when they were due. In 1994, legislation redirected revenues from the OASI trust fund to prevent the imminent exhaustion of the DI trust fund. In part because of that experience, it is a common analytical convention to consider the DI and OASI trust funds as combined. Thus, CBO projects, if some future legislation shifted resources from the OASI trust fund to the DI trust fund, the combined OASDI trust funds would be exhausted in 2031. [Emphasis added.]

23 Year Old Bob Dylan Singing His Songs

A 27 minute video of Bob Dylan in 1964 appearing on QUEST, a Canadian Broadcasting Corporation TV show, singing several of his songs while playing an acoustic guitar.

Set List:
1.The Times They Are A-Changin’
2.Talking World War III Blues
3.The Lonesome Death Of Hattie Carroll
4.Girl From The North Country
5.A Hard Rain’s A-Gonna Fall
6.Restless Farewell


Monday, December 16, 2013

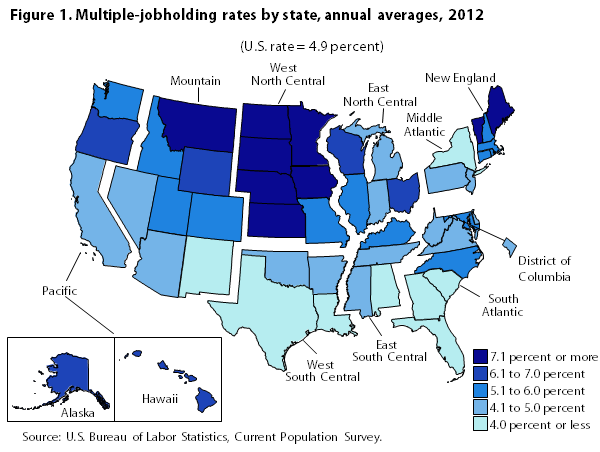
4.9 Percent Of US Workers Hold Multiple Jobs: South Dakota Has Highest Rate, 9.5 Percent: Florida Has Lowest Rate, 3.5 Percent

From Bureau of Labor Statistics, Monthly Labor Review, December 2013, "Multiple job holding in states in 2012" by Susan Campolongo:
The annual average multiple-jobholding rate for the United States was 4.9 percent in 2012, although rates varied by state.

In 2012, South Dakota recorded the highest multiple-jobholding rate of any state, 9.5 percent, followed by Vermont, 8.6 percent, and Nebraska, 8.5 percent. Four additional states had multiple-jobholding rates of 8.0 percent or above. Most of the states with high multiple-jobholding rates in 2012 have had consistently high rates over the time span during which estimates have been available. Florida had the lowest multiple-jobholding rate of any state in 2012, 3.4 percent. Four other states recorded rates below 4.0 percent. The annual average multiple-jobholding rate for the United States was 4.9 percent in 2012, unchanged from 2011 and 2010. No state had a statistically significant over-the-year change in its multiple-jobholding rate.

Multiple-jobholding rates for individual states continued to vary considerably around the U.S. average of 4.9 percent. (See figure 1 and table 1.) In 2012, 18 states had multiple-jobholding rates significantly higher than the national average, 7 states had significantly lower rates, and 25 states and the District of Columbia had rates that were not appreciably different from the national average. As in past years, northern states generally had higher rates than southern states. All but one state in the West North Central Census division had multiple-jobholding rates significantly above the U.S. average, while the New England and Pacific divisions each had all but two states with rates measurably above the U.S. average. Five of the seven states with multiple-jobholding rates significantly below the national average were located in the South region. [Footnotes and Table 1 omitted.]
Source:  Bureau of Labor Statistics

US Public Grossly Overestimates The Income Of The Rich And Extent Of Income Inequality

From Association for Psychological Science, Press Release, "Income Inequality Is Rising, But Maybe Not as Fast as You Think:"
[Survey] Participants tended to overestimate the number of American households that are just scraping by, believing that, on average, about 48% of households make less than $35,000 a year. Census data show that only 37% actually fall under that number. By contrast, participants underestimated the number of American households that are faring well. They believed that, on average, only about 23% of households make $75,000 or greater a year, when census data show that 32% actually make more than that number.

In addition, participants believed the income inequality gap was much larger than it actually is, estimating that the richest 20% makes about 31 times more than the poorest 20%. While the income gap has grown in the past 40 years, the reality is that the top 20% makes about 15.5 times more than the bottom 20% – half the size of the gap estimated by participants.

The researchers discovered that this income gap overestimation was due primarily to inflated perceptions regarding the richest 20%. In 2010, census data show that the richest 20% had average incomes of about $169,000, yet participants believed it was closer to $2,000,000.

Sunday, December 15, 2013

New Yorkers Pay More Property Tax Than State Income Tax: Westchester County Has Highest Property Tax In US

From The Journal News, lohud.com, "Cuomo: Property taxes need to be cut: Westchester, Rockland among highest in nation" by Joseph Spector:
New Yorkers pay a whopping $50 billion a year in property taxes – $10 billion more than they pay in income taxes.

Westchester and Rockland counties rank first and fourth in the nation in property taxes paid, on average nearly $10,000 a year.

And upstate, Wayne and Monroe counties pay the highest property taxes compared to home values in the country.

Saturday, December 14, 2013

40 Percent Of Working Americans Work More Than 40 Hours Per Week Including 9 Percent Who Work More Than 50 Hours Per Week

From Rasmussen Reports, "Just 31% Work A 40-Hour Week:"
A new Rasmussen Reports national telephone survey finds that only 31% of Employed Americans work 40 hours a week. Forty percent (40%) now work more than 40 hours weekly, including nine percent (9%) who work more than 50 hours a week. This compares to 33% who worked more than 40 hours a week in May.

Twenty-eight percent (28%) now work fewer than 40 hours a week, with 10% who work fewer than 20 hours weekly. That overall number is down six points from 34% in the previous survey.

Friday, December 13, 2013

US Disqualified Group Health Insurance Policies That Met ObamaCare Standards To Help Subsidize Health Exchanges

From The New York Times, "With Affordable Care Act, Canceled Policies for New York Professionals" by Anemona Hartcollis:
But while those policies, by and large, had been canceled because they did not meet the law’s requirements for minimum coverage, many of the New York policies being canceled meet and often exceed the standards, brokers say. The rationale for disqualifying those policies, said Larry Levitt, a health policy expert at the Kaiser Family Foundation, was to prevent associations from selling insurance to healthy members who are needed to keep the new health exchanges financially viable.

Alternative To Raising The Minimum Wage To Help The Poor Earn More

From The Wall Street Journal, "A Hype-Free Way to Help Low-Wage Workers: Minimum-wage hikes are job killers. Better to integrate earnings at the current rate with welfare payments." by Martin Feldstein:
There is a better way [than raising the minimum wage] to help those with low skills find employment and raise their incomes: Integrate the existing minimum wage with welfare payments. Consider a woman who receives $10,000 a year from various transfer programs but can only find occasional part-time work at the $7.25 minimum wage. Her $10,000 a year of transfer benefits is equivalent to $5 an hour based on 2,000 working hours per year. If she had the option of treating up to half of that $5 as an offset to the minimum wage—just as workers who receive tips can offset part of the minimum-wage floor because of their tip income—she could legally take any job that paid at least $4.75 an hour. If she finds a job paying $5 an hour, she might earn an extra $10,000 a year.

There may be better ways to integrate transfer payments and the minimum wage. But the goal should be to raise incomes while increasing job opportunities for those whose skills are too limited to find work at the minimum wage. Instead of raising the barrier for finding a job, as a minimum wage hike would do, integrating the minimum wage and welfare payments would allow some of today's poor and unskilled to get onto the job ladder. Then they would gain the skills and experience to rise above the minimum wage and their dependence on transfer payments.

Wednesday, December 11, 2013

CBO Cost Estimate Of Bipartisan Budget Act 2013: Full Text

From Congressional Budget Office, Cost Estimate, Bipartisan Budget Act of 2013, December 11, 2013:

CBO Estimate of Bipartisan Budget Act of 2013

Students With Highest Gains On Standardized Test Scores Do Not Show Similar Gains To Analyze Abstract Problems And Think Logically

From Association for Psychological Science, Press Release, "Even When Test Scores Go Up, Some Cognitive Abilities Don’t:"
But new research shows that schools whose students have the highest gains on [standardized] test scores do not produce similar gains in “fluid intelligence” — the ability to analyze abstract problems and think logically.

The research, conducted by researchers at MIT, Harvard University, and Brown University, is forthcoming in Psychological Science, a journal of the Association for Psychological Science.

Data from nearly 1,400 eighth-graders in the Boston public school system showed that some schools have successfully raised their students’ scores on the Massachusetts Comprehensive Assessment System (MCAS). However, those schools had almost no effect on students’ performance on tests of fluid intelligence skills, such as working memory capacity, speed of information processing, and ability to solve abstract problems.

"It doesn’t seem like you get these skills for free in the way that you might hope, just by doing a lot of studying and being a good student," says psychological scientist and senior author John Gabrieli, the Grover M. Hermann Professor of Health Sciences and Technology, professor of brain and cognitive sciences, at MIT.

Democrats Have 49 Percent Chance Of Losing US Senate Majority: Iowa Electronic Election Markets: Corrected

[Corrected version. Previous version had majority Congressional chambers reversed.]

Republicans have 28.5 percent chance of losing US House of Representatives majority in 2014 election..

Democrats have 49 percent chance of losing US Senate majority in 2014 election.

From Iowa Electronic Election Markets, December 10, 2103 prices:

Market Quotes: House14
2014 House Control Market.

Quotes current as of 22:15:00 CST, Tuesday, December 10, 2013.
SymbolBidAskLastLowHighAverage
RH.gain140.3000.4240.425---------
RH.hold140.4200.5050.515---------
RH.lose140.2160.2790.285---------


Market Quotes: Senate14
2014 Senate Control Market.

Quotes current as of 22:15:00 CST, Tuesday, December 10, 2013.
SymbolBidAskLastLowHighAverage
DS.gain140.1020.1590.109---------
DS.hold140.4150.5690.497---------
DS.lose140.3930.4750.490---------

Tuesday, December 10, 2013

A Decade Ago, All Political Parties, Democrats, Independents And Republicans, Wanted Stricter Environmental Laws And Regulations: Now Its Mostly Democrats

From Bloomberg Opinion. "What's the Cost of Blocking the Keystone Pipeline?" by Christopher Flavelle:
In 1992, when the Pew Research Center asked people whether there needed to be stricter laws and regulations to protect the environment, 93 percent of Democrats said yes -- and so did 86 percent of Republicans. When Pew asked the same question last year, Democrats' support was still at 93 percent; Republicans' had fallen to 47 percent. Interestingly, that drop predated Barack Obama becoming president.

Source:  Bloomberg Opinion
***
[Jim] Kolbe [a retired Arizona congressman] also pointed to something else that environmentalists should be concerned about: the view that moral browbeating has left more Republicans willing to ignore the climate-change movement. "Aren't we terrible stewards of the earth," is how he described the tone of the debate. "For some Republicans, they get tired of it."

Jeremy Carl, a climate-change expert at Stanford University's conservative-leaning Hoover Institution, made a similar point, arguing that "the moral climate around this issue has really poisoned it."
***
Which brings us back to Keystone. The pipeline debate raises the question of just how useful the environmentalists' intransigence, which has been crucial to their opposition, can be as a long-term strategy. There are no compromises offered, and no consideration for the validity of any of the arguments made by Keystone's proponents. The concerns of people who stand to get work by building the pipeline aren't just outweighed; they're irrelevant. You're either for the pipeline or against it.

Case in point: When reports surfaced a few months ago that Canadian Prime Minister Stephen Harper offered unspecified offsetting carbon emissions in return for a U.S. decision to approve Keystone, opponents of the pipeline didn't exactly embrace the possibility. Yet if the goal is reducing emissions, that would have been a good deal. If the goal is just killing a pipeline, it wouldn't. But what good is that goal all by itself?

Overzealous, Possibly Politicized, SEC Enforcement Division Hires Jury Consultant To Overcome Losses In High Profile Cases

From The Washington Times, "Mark Cuban mocks SEC lawyers, hails feds’ move to bring in hired guns: Mock jurors to aid agency attorneys" by Jim McElhatton
Facing a string of recent high-profile courtroom defeats, the Securities and Exchange Commission wants to a hire a mock trial firm to help agency lawyers get ready for big cases.

A jury consulting firm would assist the SEC on "high profile and/or complex" cases by hiring dozens of mock jurors and videotaping arguments from trial lawyers to help them fine tune their closing arguments.
***
Last week, for instance, a legal trade news website — law360.com — noted the SEC trial loss against a former executive of government contractor NIC Inc. in a story headlined, "SEC’s Courtroom Cred Slips as Trial Losses Mount." A jury had ruled against the agency when it found NIC’s former chief financial officer not guilty of a dozen federal charges brought by the SEC.

Two months earlier, the SEC was defeated at trial after accusing Dallas Mavericks owner Mark Cuban of insider trading. And in another closely watched case, the SEC lost last year after a jury cleared former Citigroup employee Brian Stoker, whom regulators accused of negligence in a mortgage securities case.
***
Mr. [Mark] Cuban had sharp words for SEC lawyers working on his case, saying ... "seemed like he was doing it for the first time."

"If my case is any indication, the SEC has no concept of reality when it comes to dealing with juries," he said.
"Getting feedback will create self-awareness for their attorneys,” Mr. Cuban said. “The big question will be what happens when a mock jury tells them they have no case."

Hiring a consultant hardly guarantees trial success, though. In Mr. Cuban’s case, the SEC spent at least $24,000 for jury consulting services, federal procurement records show.

Monday, December 9, 2013

US Sells Remaining GM Shares And Takes Investment Loss

From The New York times, Dealbook, "U.S. Sells Remaining Stake in General Motors" by Annie Lowrey:
The Treasury Department announced on Monday that the government had sold its remaining shares of General Motors stock.

The government has thus exited one of the most controversial investments made during the midst of the financial crisis, when it stepped in to rescue the Detroit automakers – a decision that as many as three in four Americans opposed at the time.

Taxpayers recouped about $39 billion on the investment, the Treasury Department said, having spent about $50 billion bailing out the automaker.

Videos Of 2013 Economics Nobel Prize Lectures: Fama: Hansen: Shiller

The Sveriges Riksbank Prize in Economic Sciences in Memory of Alfred Nobel, 2013 lectures by Eugene F. Fama, Lars Peter Hansen, Robert J. Shiller, Dec 9, 2013. Each winner's talk is about 35 to 36 minutes long and the 3 videos are in total about 1 hour and 45 minutes. Videos are in the order presented by the Nobel Committee on its website. Links to lecture slides precede each video link. [I removed the embedded videos because they would not start at the beginning of each winner's lecture due to a malfunction in one of the Google Youtube parameters. Each video link below begins at the start of the named economist's lecture.]

Eugene F. Fama - Prize Lecture, "Two Pillars of Asset Pricing" by Eugene F. Fama, University of Chicago, IL, USA:

Lecture Slides.

Video of Fama's Nobel lecture.


Lars Peter Hansen - Prize Lecture, "Uncertainty Outside and Inside Economic Models" by Lars Peter Hansen, University of Chicago, IL, USA:

Lecture Slides:

Video of Hansen's Nobel lecture.


Robert J. Shiller - Prize Lecture, "Speculative Asset Prices" by Robert J. Shiller, Yale University, New Haven, CT, USA:

Lecture Slides.

Video of Shiller's Nobel lecture.

21 Percent of US Working Age Adults Are In Top 2 Percent By Income For At Least One Year: Percentage Doubled Since 1979

From TIME, Business & Money, "Rising Riches: 1 in 5 in U.S. Reaches Affluence" by Hope Yen, Associated Press:
Fully 20 percent of U.S. adults become rich for parts of their lives, wielding outsize influence on America’s economy and politics. This little-known group may pose the biggest barrier to reducing the nation’s income inequality.
***
Made up largely of older professionals, working married couples and more educated singles, the new rich are those with household income of $250,000 or more at some point during their working lives. That puts them, if sometimes temporarily, in the top 2 percent of earners.

Even outside periods of unusual wealth, members of this group generally hover in the $100,000-plus income range, keeping them in the top 20 percent of earners.
***
In a country where poverty is at a record high, today’s new rich are notable for their sense of economic fragility. They’ve reached the top 2 percent, only to fall below it, in many cases. That makes them much more fiscally conservative than other Americans, polling suggests, and less likely to support public programs, such as food stamps or early public education, to help the disadvantaged.
***
New research suggests that affluent Americans are more numerous than government data depict, encompassing 21 percent of working-age adults for at least a year by the time they turn 60. That proportion has more than doubled since 1979.

Yearly Growth Rates For Health Care Spending Declined Over Last Decade

From John Goodman's Health Policy Blog, "Krugman: Wrong Again About ObamaCare" by John Goodman:
Health Care Spending Yearly Growth Rates 2002 To 2012
Source:  John Goodman's Health Policy Blog

[A]s the chart clearly shows, the slowdown in the rate of health care inflation has been steady and stretches over almost the entire decade before the Affordable Care Act became law. Whatever the cause, it started early on George Bush’s watch ― not under Barrack Obama.

Moreover, ObamaCare doesn’t really begin until this coming January. All the changes up to now have been cost increasing ― providing risk pool insurance to the uninsurable, forcing private plans to cover more benefits, and adding such extras to Medicare as free "wellness exams."

Earned Income Tax Credit More Effective Helping Poor Than Raising Minimum Wage: Only 21 Percent Of Families Benefiting From Increased Federal Minimum Wage Are Poor: 31 Percent Benefiting Make 3 Times Poverty Level

From The New York Times, "The Minimum Wage Ain’t What It Used to Be" by David Neumark:
So suggesting that federal policy addressing low-wage work and low-income families has somehow failed because the minimum wage has not kept pace with inflation ignores the fact that we have moved away from a focus on the minimum wage — a policy with many flaws — and toward the earned-income tax credit. We shouldn’t be asking simply how much the real minimum wage has changed, but rather how much the combined income floor generated by the two policies has changed.

To provide an example, the blue line in the figure below shows the wages received by a single adult worker earning the minimum wage and working full time throughout the year. This can be interpreted as the income floor established by the minimum wage. The red line shows the level of family income when the earned-income tax credit for a family with two children is added (all in 2012 dollars). The lower line illustrates the income consequences of the real decline in the minimum wage. But the upper line shows that, because of the sharp increase in the generosity of the earned-income tax credit, the combined effect of the two policies is that the real income of this family is as high or higher than it was in past decades — when the real minimum wage was relatively high — and much higher than it was in most of the intervening years.

Income With And Without Earned Income Tax Credit Graph
Source: The New York Times

Nonetheless, there are important differences between the earned-income tax credit and the minimum wage. The fundamental difference is that the earned-income tax credit aims benefits at low-income families with children, rather than simply low-wage workers. This is in large part its virtue, and it makes a lot more sense than the minimum wage’s focus on low-wage workers. Do we really care if a low-wage teenager in a middle-class family makes an extra dollar an hour? Economists of all persuasions in the minimum-wage debate agree that mandated wage floors do a bad job of directing benefits to low-income families. This is confirmed in recent research by my graduate student Sam Lundstrom, calculating who would be affected by increasing the current federal minimum to $8.25 from $7.25. He finds that only 21.3 percent of the affected workers would be in poor families, while 30.9 percent would be in families with incomes more than three times the poverty line.

More Than Half Of US Renters Pay Over 30 Percent Of Their Income for Rent

From MacArthur Foundation, "U.S. Renters Face Growing Affordability Problems:"
For the first time, more than half of all U.S. renters spend more than 30 percent of their income on rent, according to a new report released by the Harvard Joint Center for Housing Studies.
***
The escalating affordability problem comes at a time when the number of Americans who rent is increasing while wages remain stagnant.

Friday, December 6, 2013

Copy Of Complete Federal Bankruptcy Court Decision Allowing Detroit To Enter Bankruptcy And Treat Unfunded Pensions As General Creditors

Copy of Judge Steven Rhodes US Bankruptcy Court decision allowing Detroit to enter bankruptcy is embedded below, available as a pdf on the bankruptcy court website, and available on Scribd.

Opinion Regarding Detroit Bankruptcy Eligibility 12.5.131

Labor Unions Provided The Political Support For Apartheid In S Africa

From The Circle Bastiat, "Mandela and the Economics of Apartheid" by Peter G. Klein:
Apartheid is widely misunderstood as a system based purely on racial prejudice, while it was actually a more complex mix of economic controls (primarily, restrictions on capital ownership and movements of labor) and racial separatism — what Tom Hazlett calls "socialism with a racist face." Apartheid’s political support came primarily from working-class (white) Afrikaners and their labor unions eager to suppress competition from unskilled black labor. As Hazlett notes: "The conventional view is that apartheid was devised by affluent whites to suppress poor blacks. In fact, the system sprang from class warfare and was largely the creation of white workers struggling against both the black majority and white capitalists."
Similarly, in the US, labor unions and minimum wage laws kept Blacks from competitng with Whites for jobs.

Randomized Trials Show Vitamin D Supplements Not Cancer, Heart Disease Reducer

From Bloomberg, "Vitamin D Shows No Benefit Against Cancer, Heart Disease" by Makiko Kitamura:
Vitamin D supplements don’t help prevent chronic diseases unrelated to the bones, according to a review of published research that challenges the prevailing wisdom held by proponents.
***
The randomized trials on vitamin D showed little to no effect in lowering risk for heart disease, diabetes, infectious diseases and mood disorders, among other conditions. In contrast, the observational studies generally reported moderate to strong effects on these disorders.

In cancer, observational studies showed the supplements had a protective effect on colorectal cancer, an outcome that wasn’t confirmed in two large randomized trials.

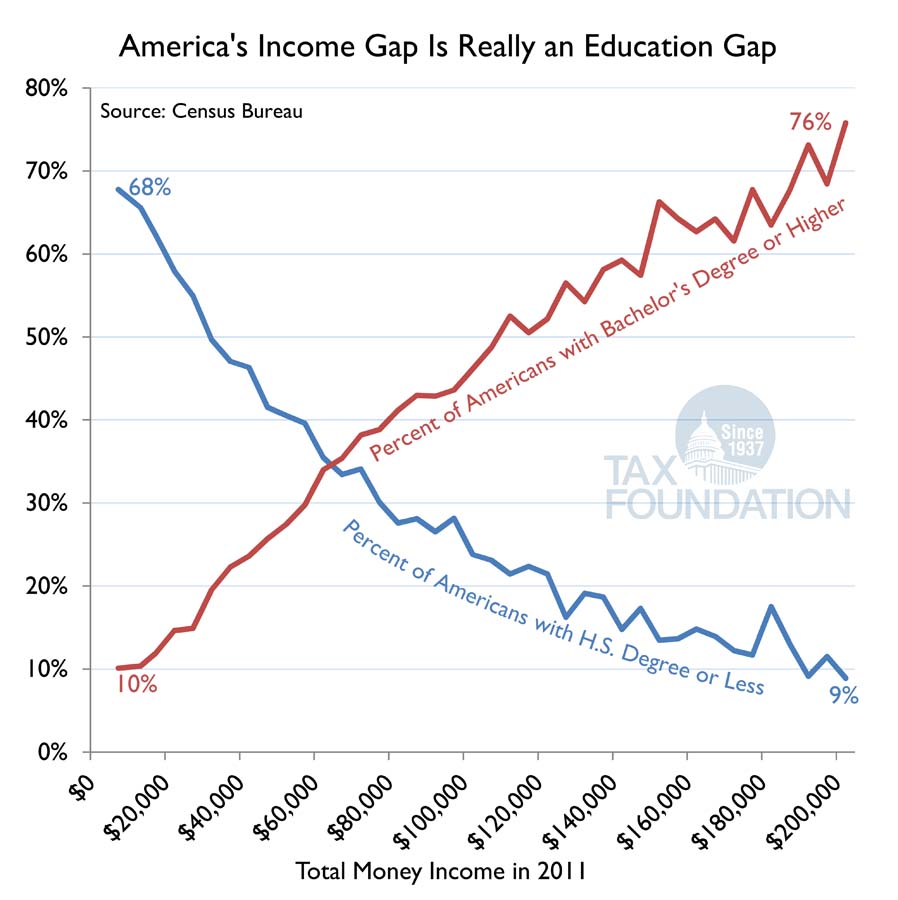
Unequal Income Comes From Unequal Education

From Tax Foundation, "America's Income Gap Is Really an Education Gap" by Scott A Hodge and Andrew Lundeen:

Income Vs Education
Source: Tax Foundation

Also, see yesterday's post, "Median US Income By Education Level."

GDP Value Of The Arts Is About 3.2 Percent Of GDP

From The Wall Street Journal, Real Time Economics, "U.S. Arts Sector Is Bigger Than Tourism Industry" by Eric Morath:
Starving artists? Not quite. America’s arts and cultural sector is a half-trillion-dollar machine that’s larger than major industries such as travel and tourism, a new official estimate found.

GDP Value Of The Arts
Source:  The Wall Street Journal

The arts contributed $504 billion to U.S. economic output in 2011, or 3.2% of gross domestic product, the Commerce Department said Thursday. The report is the first time the government calculated the sector’s size.

About 100 Firefighter Are Arrested For Arson Each Year: Boredom Likely Cause of Firefighter Arson

From THE AWL, "Fire Bugs" by Rachel Monroe:
Every year, something like 100 firefighters are arrested for arson-related crimes. In one year, 1994, South Carolina alone charged 47 firefighter-arsonists, besting their 1993 record of 33 arrests. "It happens more than you think," former federal agent Daniel Hebert told the St. Louis Post-Dispatch. "Really, it goes on way more than anyone knows. We don’t know about most of them."
***
Most firefighter-arsonists have never even considered setting fires before they joined up. The idea comes later, after a few months or years of service. In other words, it’s not the evil arsonists who are ruining our fire departments; it’s our fire departments that are igniting something destructive in our firefighters.
***
But most firefighter-arsonists aren’t motivated by money as much as, well, boredom—that, and a desire to prove themselves.

Seventy percent of firefighters in the U.S. are volunteers—it’s generally only cities that can afford to pay their firefighters—and many of them serve in small towns, suburbs, and rural areas.

Rural small-town firefighting is, on balance, boring.
***
The average firefighter-arsonist is a young white male of above-average intelligence, no criminal record, and "poor occupational adjustment." It is unclear how significantly this profile differs from, say, the average firefighter who does not commit arson. He works for a fire service that doesn’t get many calls, which may be why he’s eager to prove himself. He tends to start with small grass or Dumpster fires, and then progress to abandoned houses or garages. It’s rare that a firefighter-arsonist will opt for inhabited buildings, or locations where people are likely to be hurt.

Firefighter-arsonists often work in teams, egging each other on. "Before the fire, we were just sitting around bored," said Robert Vasquez, who admitted to committing arson in Prince George’s County, near D.C., in 1990. "We were talking about how the Chief yells at us for the things we do wrong and everybody was saying ‘Let’s wait for the next fire to come out and maybe we can do good on it’… And then the words, ‘Set a fire’ came up."
***
[A] significant number of firefighter arsonists are not "little men" or pathetic losers who want to wreak havoc on a society that’s rejected them, but rather overachievers, team players, firefighter-of-the-year types.
***
We found that a lot of these young men didn't have an awful lot in their lives to distinguish them except for their association with the fire service," said Ken Cabe, who studied firefighter arsonists for the South Carolina State Forestry Commission. "They were highly motivated, they were highly trained and maybe the alarm didn't go off often enough for them."

In other words, a firefighter who sets fires may not be some entirely separate and deviant kind of person, but rather a good guy who goes to extremes. And firefighting, with its long stretches of boredom punctuated by moments of extreme danger, inspires extremes.

Thursday, December 5, 2013

My Wall St Journal Comment On Inequality Measurements

My posted comment to The Wall Street Journal, Real Time Economics, "How Do You Measure ‘Inequality’?" by Damian Paletta:
All inequality measures including the GINI index have many known problems. All members of demographic groups can see no change in their income and yet if the number of members in each group changes, Household and Family GINI will change. Inequality measurements are point in time measurements that do not adjust for changing demographics. Increases in the number of retirees, adult immigrants, college graduates with starting salaries, part-time working students, high school drop-outs, non-college attending HS graduates, college drop-outs, unwed mothers, divorces, returning to work parents, part-time working parents, long term experienced workers with yearly raises, and other groups will increase Household and Family GINI without any increase in Individual income GINI.

Individual income GINI in the US has remained constant and unchanged since 1962. Household and family GINI have increased. Social and cultural factors play a huge role in the increase of US Household and Family inequality and not wage or other economic factors.

Size of a country also matters since a larger developed country will show a higher GINI measurement of inequality than a smaller developed country. For example, in the US, GINI compares places like the wealthy suburbs of NYC and Palo Alto with less wealthy places like Biloxi or Bangor. Imagine if Greece's income is combined with Germany or Sweden, the GINI measurement would increase without any change to worker income.

GINI also does not adjust for cost of living differences. Does anybody believe that the same income can pay the astronomical rents of NYC or San Francisco as in Detroit or Tampa? Equalizing for cost of living disparities is a necessary adjustment before one can make any statement about US inequality and it will show a lower level of US inequality.

69 Percent Of Minimum Wage Earners Work Part-Time: Most Are Under 25 Years Old: 5 Percent Of US Hourly Workers Earn Minimum Wage

From The Wall Street Journal, Opinion, "Obama's Minimum-Wage Omissions" by Jason L Riley:
Nor will you hear the president say that only about five percent of hourly workers in the U.S. earn the minimum wage, that most are 25 or younger and that 69 percent of them work part-time. You won't hear him acknowledge that the typical minimum-wage earner is not the family's sole or most important breadwinner. And you won't hear him admit that the beneficiary of a minimum-wage increase is more likely to be a teenager in the suburbs than a single mom in Anacostia. Moreover, hiking the minimum wage will diminish the job prospects for that single mom, but Mr. Obama won't say that, either.
***
Labor unions like minimum-wage hikes because they increase the price of labor among non-union workers who compete with their members (who already earn wages far above the minimum) for jobs.
***
The last thing jobless blacks need is a minimum-wage hike. "The last year in which black unemployment was lower than white unemployment—1930—was also the last year in which there was no federal minimum wage," writes Thomas Sowell in his most recent book, "Intellectuals and Race." [Link added.]
>

Social Factors And Not Economic Factors Are Cause Of Increase In US Income Inequality Over The Last 50 Years

From Political Calculations, "The Major Trends in U.S. Income Inequality Since 1947" by Ironman:

Source:  Political Calculations

After 1960 however, ... the level of income inequality among U.S. individuals stabilized. The Gini coefficient for U.S. individuals has been essentially flat ever since, falling within a very narrow range.

That observation is significant because if income inequality in the United States was really rising as a result of economic factors that concentrate an increasing amount of income into progressively fewer hands, we would not observe this outcome because income payments are made to individuals, not to households and not to families. That basic reality means that a rising level of economically-driven income inequality would be most prominently evident among the distribution of income for individuals as measured by the Gini coefficient if it were actually taking place - just like it did in the post-World War 2 recovery years from 1947 through 1960.

We do however observe such a rising trend in measured income inequality in the Gini coefficients calculated for U.S. households and for U.S. families. Interestingly, we don't see much of that change occurring when economic factors were actually driving up the level of income inequality among individual American income earners in the years from 1947 through 1960. Instead, we see that the overall trend for household and family inequality was basically flat during this time, which then continued through the 1960s. It's not until 1970 that we find that a rising trend in the amount of income inequality for U.S. households and families begin to take hold.

From 1970 through 1992, we see that the amount of income inequality among U.S. households and families increases steadily - and since we don't observe a similar trend among individuals, we must conclude that social factors, such as the changing composition of the nation's families and households over time, are the primary cause of that trend. [Emphasis added.]

Median US Income By Education Level

From Tax Foundation, "Median Incomes Vary Greatly by Educational Attainment" by Scott A Hodge and Andrew Lundeen:
One of the biggest contributors to rising inequality in America today is the growing earnings gulf between workers with college degrees and those without. Indeed, the median income for all households was $51,244 in 2011. By contrast, the median income for a household headed by a worker with a four-year college degree was $78,251, more than 50 percent above the typical household. Those with professional degrees earn more than twice the median household income.

Median Incomes By Education
Source: Tax Foundation