The study [from the Georgia Institute of Technology and Universidad Autonoma de Aguascalientes (UAA), Mexico] found that mixing the dispersant with oil increased toxicity of the mixture up to 52-fold over the oil alone. In toxicity tests in the lab, the mixture’s effects increased mortality of rotifers, a microscopic grazing animal at the base of the Gulf’s food web. The findings are published online by the journal Environmental Pollution and will appear in the February 2013 print edition.Terry Snell, chair of the Georgia Institute of Technology School of Biology said, "Perhaps we should allow the oil to naturally disperse. It might take longer, but it would have less toxic impact on marine ecosystems."
Using oil from the Deep Water Horizon spill and Corexit, the dispersant required by the Environmental Protection Agency for clean up, the researchers tested toxicity of oil, dispersant and mixtures on five strains of rotifers. Rotifers have long been used by ecotoxicologists to assess toxicity in marine waters because of their fast response time, ease of use in tests and sensitivity to toxicants. In addition to causing mortality in adult rotifers, as little as 2.6 percent of the oil-dispersant mixture inhibited rotifer egg hatching by 50 percent. Inhibition of rotifer egg hatching from the sediments is important because these eggs hatch into rotifers each spring, reproduce in the water column, and provide food for baby fish, shrimp and crabs in estuaries. [Emphasis added.]
Friday, November 30, 2012
EPA Required Dispersant For BP Oil Spill Clean-Up Increased Toxicity 52 Fold: The EPA Cure Is Worse Than The Spill And Worse Than Letting Nature Clean-Up The Oil
From "Worse Than the Problem: Clean-up Makes 2010 Spill 52x More Toxic" on ScienceBlog:
Majority Against Government Guaranteed Healthcare For All
From Gallup Politics, "In US, Majority Now Against Gov't Healthcare Guarantee: Views of healthcare system overall more positive in some respects" by Jeffrey M. Jones:
For the first time in Gallup trends since 2000, a majority of Americans say it is not the federal government's responsibility to make sure all Americans have healthcare coverage. Prior to 2009, a majority always felt the government should ensure healthcare coverage for all, though Americans' views have become more divided in recent years.
Source: Gallup
Thursday, November 29, 2012
Debt Limit Increase Not Needed Until Mid-February, CBO Expects
From CBO, "When Is Federal Debt Likely to Reach the Statutory Limit?"
The Treasury anticipates that borrowing will reach the current limit near the end of December 2012. However, because the Treasury can take certain “extraordinary measures” that it has used previously when borrowing reached or approached the debt limit, CBO expects that the department will be able to continue funding government activities without an increase in the debt limit until mid-February or early March.
Wednesday, November 28, 2012
In Canada, Young Adults More Likely To Smoke Pot And Drive Than Drink And Drive
From "Young adults more likely to smoke pot than drink before driving" on ScienceBlog:
"More young adults are reporting that they drive within an hour of using cannabis – even more than those who report drinking and driving," says Dr. Robert Mann, CAMH [Centre for Addiction and Mental Health] Senior Scientist and lead researcher. "Yet the risks of doing so are significant." Nine per cent of 18- to 29-year-olds report driving after cannabis use, versus six per cent in this age range who report drinking two or more drinks and driving.
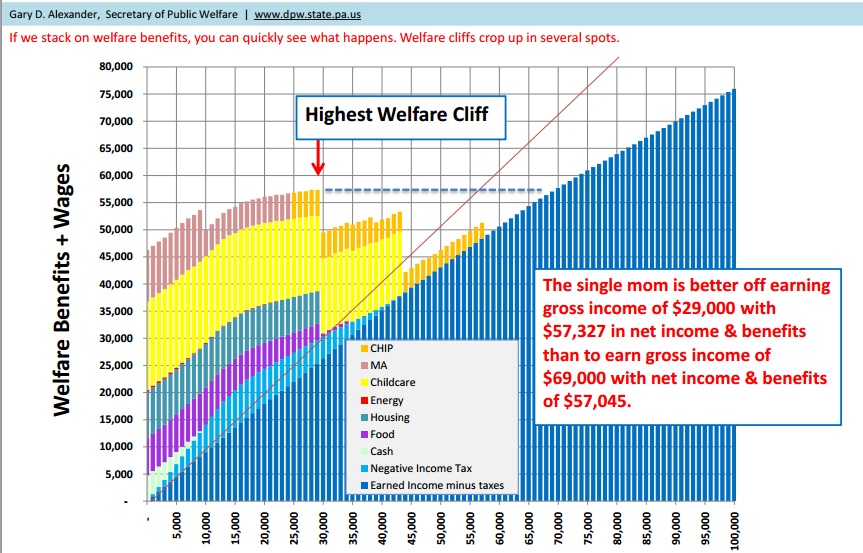
A $29,000 US Wage Earner With Government Benefits Surpasses A $69,000 Wage Earner
A single Mom making $29,000 is better off in The US than a Mom making $69,000.
From Division of Labour, "The Welfare Trap" by E Frank Stephenson:
From Division of Labour, "The Welfare Trap" by E Frank Stephenson:
 |
| Source: Division of Labour |
Sunday, November 25, 2012
Toyota's Avalon Is The Most American Made Car
From The Street, "10 Most American-Made Cars Of 2012" by Jason Notte:
1. 2012 Toyota AvalonThe complete list of the ten most American made cars is here.
Assembled: Georgetown, Ky.
Percentage Made In U.S.: 85%
Yep, the ultimate American full-size is the most American-made car on this list. ... Toyota actually makes a car with even more American parts than the Avalon -- the 95% U.S. Matrix -- but their choice to assemble it across the border in Canada disqualified it. When you say "American-made" down here in the states, "North America" isn't exactly what folks have in mind.
Saturday, November 24, 2012
Women To Pay More Than Men For Long Term Care Insurance
From The Wall Street Journal, "Women Face Higher Costs" by Kelly Greene:
Until now, insurers have charged the same premiums regardless of gender for the [long-term-care insurance] policies, which help pay for future nursing-home, assisted-living and home care. But beginning early next year, Genworth Financial, the country's largest long-term-care insurer, plans to start charging women applying for coverage as much as 40% more than men.
The move is designed to better reflect the risks involved in covering women, who are paid two out of every three benefit dollars from long-term-care insurance, in part because they live longer and often have no caregivers at home, according to the American Association for Long-Term Care Insurance, a trade group based in Westlake Village, Calif.
Other insurers are expected to follow Genworth's lead, says Jesse Slome, the association's executive director.
Friday, November 23, 2012
Ob-Gyn's Push For Oral Contraceptives To Be Available Over The Counter Without A Prescription or Doctor Visit
From "Over-the-Counter Access to Oral Contraceptives" by The American Congress of Obstetricians and Gynecologists, Committee on Gynecologic Practice, December 2012:
Unintended pregnancy remains a major public health problem in the United States. Access and cost issues are common reasons why women either do not use contraception or have gaps in use. A potential way to improve contraceptive access and use, and possibly decrease unintended pregnancy rates, is to allow over-the-counter access to oral contraceptives (OCs). Screening for cervical cancer or sexually transmitted infections is not medically required to provide hormonal contraception. Concerns include payment for pharmacist services, payment for over-the-counter OCs by insurers, and the possibility of pharmacists inappropriately refusing to provide OCs. Weighing the risks versus the benefits based on currently available data, OCs should be available over-the-counter. Women should self-screen for most contraindications to OCs using checklists.
Thursday, November 22, 2012
Early Breast Cancer Screening Does Not Save Lives: Leads To Overdiagnosis And Unnecessary Treatment
From Bloomberg, "Early Breast Cancer Screens Shown to Have Limited Benefit" by Nicole Ostrow:
The number of early breast tumors detected by mammogram hasn’t led to a corresponding reduction of advanced cancer, findings that suggest increased screening has led to over diagnosis and unneeded treatment, researchers said.From The Wall Street Journal, "Study Questions Benefits of Mammogram Screening" by Melinda Beck:
Mammograms have doubled the number of early-stage breast cancers detected in the U.S. each year, while the rate of advanced disease has declined just 8 percent annually, according to a study published yesterday in the New England Journal of Medicine. One third of breast cancers detected and treated posed no threat to health, the research also found.
The study backs the 2009 guidelines by the U.S. Preventive Services Task Force that advise against routine mammograms for women ages 40 to 49 who aren’t at increased risk for breast cancer.
More than one million U.S. women have been diagnosed and treated unnecessarily for breast cancer in the 30 years since screening mammograms become widespread, according to a study in the New England Journal of Medicine.
In 2008, the most recent year studied, nearly 1 in every 3 breast cancers were "overdiagnosed"—that is, they never would have caused symptoms if they had been left alone, the study concluded.
The findings add to the growing body of evidence that suggests screening women for breast cancer leads to unnecessary treatment while saving few lives, likely fueling the controversy about when and how often to have regular mammograms.
Saturday, November 17, 2012
Is Sexual Envy Behind Obama's Fight For Taxing The Rich And Income Equality?
From The Wall Street Journal "Does Survival of the Sexiest Explain Civilization?" by Matt Ridley:
Jason Collins' research paper that prompted Ridley's Wall St Journal article is available here for free as a PDF.
Recently Jason Collins and two colleagues at the University of Western Australia ... have made the case that sexual selection explains civilization itself. ... "as females prefer males who conspicuously consume, an increasing proportion of males engage in innovation, labor and other productive activities in order to engage in conspicuous consumption. ...."I suggest you read the entire Ridley article.
Psychological evidence points the same way. In one experiment, men who were shown pictures of women promptly expressed more extravagant desires for expensive luxuries, whereas women showed no such effect after seeing pictures of men.*** Moreover, Michael Shermer, in his book "The Mind of the Market,"argues that you can trace anticapitalist egalitarianism to sexual selection.
*** If so, this might explain why it is relative, rather than absolute, inequality that matters so much to people today. In modern Western society, when even relatively poor people have access to transport, refrigeration, entertainment, shoes and plentiful food, you might expect that inequality would be less resented than a century ago—when none of those things might come within the reach of a poor person. What does it matter if there are people who can afford private jets and designer dresses?
But clearly that isn't how people think. They resent inequality in luxuries just as much if not more than inequality in necessities. They dislike (and envy) conspicuous consumption, even if it impinges on them not at all. What hurts is not that somebody is rich, but that he is richer.
This is a classic statement of sexual selection. It isn't the peacock with the big-enough tail that gets to mate; it's the peacock with the biggest tail.
Jason Collins' research paper that prompted Ridley's Wall St Journal article is available here for free as a PDF.
Video On How To Make A Twinkie At Home
From "How To Make Twinkies - Video Recipe" by Nicko's Kitchen:
INGREDIENTS:
1/2 cup SR [self-rising aka cake] flour
1/4 cup all-purpose flour
1/4 teaspoon salt
2 tablespoons milk
4 tablespoons unsalted butter
1/2 teaspoon vanilla extract
5 eggs (separate egg whites and yolks)
3/4 cup caster sugar
Melt butter in milk, add vanilla
Beat egg whites until soft peaks
Mix remaining dry ingredients with milk, butter, vanilla mixture and egg yolks.
Fold in beaten egg whites
Bake at 175 Celsius degrees (350 Fahrenheit degrees) in canoe or twinkie pan for 13-15 minutes.
FILLING:
3/4 cup caster [aka fine or superfine] sugar
1 tablespoon corn syrup
3 egg whites
pinch salt
1/2 teaspoon vanilla extract
Stir over low heat 3-4 minutes until sugar dissolves.
Mix mixture for 7 minutes starting at low speed going up to medium to high speed until like meringue.
Fill cakes.
Friday, November 16, 2012
Best Ways To Say No In Business
From Time Business & Money, originally published at Inc.com, "3 Best Ways to Say ‘No’ " by Marla Tabaka:
Sometimes it feels like there’s just way much to do and too little time.Read more.
You may believe that, but it’s not necessarily true. Perhaps you’re just spreading yourself too thin, and that can change.
There are many helpful productivity and time management tips, but I believe the most powerful one is the art of saying no.
So Long Sweet Friend
From Bloomberg, "Twinkie Maker Hostess to Shut Down After Strike" by Dawn McCarty and Phil Milford:
 |
| Source: Bloomberg |
Hostess Brands Inc., the maker of Wonder bread and Twinkies, said it will shut down and liquidate after a strike by members of its bakery workers’ union “crippled” the company’s operations.
From Tax Cliff To Economic Abyss: Obama's Tax On The Rich
From The Wall Street Journal, "Stephen Moore: Why Lower Tax Rates Are Good for Everyone: If we want millionaires to pay more taxes, then we need an economy where there are more millionaires" by Stephen Moore:
President Obama on Wednesday announced that any budget deal must include $1.6 trillion from higher taxes. "When it comes to the top 2%," he said, "what I'm not going to do is to extend further a tax cut for folks who don't need it." He argued that we are never going to get anywhere near balancing the budget without more revenue from people earning above $250,000 a year.
He's probably right about that, though not in the way he intends. The country needs an economy that will create more of the "millionaires and billionaires" that Mr. Obama loves to excoriate, not more taxes from those who already exist. Total taxes paid by millionaires fell by almost $100 billion between 2007 and 2010, the last year with statistics available from the Internal Revenue Service. The drop resulted not from too-low tax rates, but from the severe recession and an anemic recovery since 2009 that thinned the ranks of the wealthy.
If Mr. Obama wants the Warren Buffetts and Justin Biebers to shoulder more of the nation's tax burden, he would do well to pay attention to the history of tax rates. Over the past century, lower rates have shifted the tax burden onto high-income earners and away from the middle class while maintaining the tax code's progressivity.*** Some liberals acknowledge these fiscal facts of life but argue that tax revenues from the wealthy increased simply because the rich got richer. And so they did. But the economic growth that was touched off by lower tax rates, particularly in the 1960s and 1980s, also benefited middle-class incomes and living standards. If Mr. Obama has his way and raises tax rates on upper-income groups, it will slow the economy, and everyone will lose.
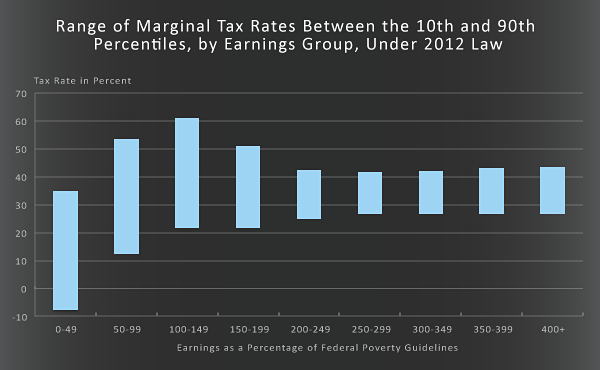
Marginal Tax Rates In The 450 Percent Of Federal Poverty Guidelines And Under Group Will Rise To 35 Percent In 2014: Higher Marginal Tax Rates Provide Incentives Not To Work Or To Increase Work Hours: Similar To The Unemployment, Part-time And Labor Force Participation Data During This Post Recession
According to CBO, the combined effect of the expansion of SNAP (Food Stamp) eligibility, the temporary reduction in payroll taxes, the refundable tax credits in the Affordable Care Act to help cover the cost of health insurance, along with new subsidies for cost sharing under health insurance policies, will raise marginal tax rates for taxpayers in the 450 percent of Federal Poverty Guidelines and under, the group CBO studied, to 35 percent in 2014, on average.
High marginal tax rates of individuals receiving means tested benefits reduces an individual member's incentive to find work and to earn more income through extra work hours.
CBO is indirectly saying that the benefits put into place during the recession and Obama's first term, including tax benefits and subsidies in the new health care law and the temporary reduction in payroll taxes, raised and will further raise marginal tax rates and create incentives not to work. The potential loss of tax credits, subsidies and benefits provide incentives not to find work and increase unemployment, increase part-time employment and lower employment participation rates. These are the effects seen in the current post recession US employment data.
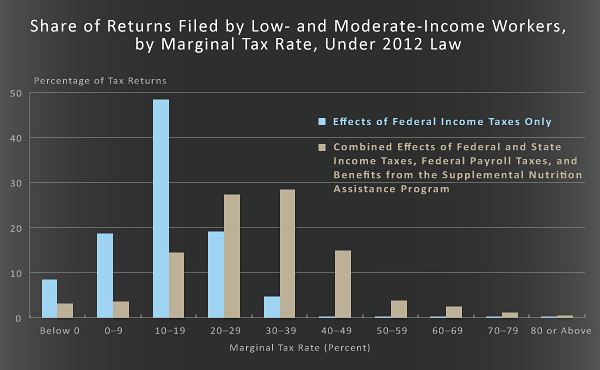
From Congressional Budget Office report, "Effective Marginal Tax Rates for Low- and Moderate-Income Workers:"Working Taxpayers with Income Below 450 Percent of Federal Poverty Guidelines Face a Marginal Tax Rate of 30 Percent, On Average, Under 2012 Law
Some provisions of taxes and transfers, such as statutory income tax rates and federal payroll taxes, affect most workers. (Statutory income tax rates are specified in law and apply to the last dollar of earnings.) Other provisions, such as reductions in tax credits and SNAP benefits, affect fewer people but result in relatively high marginal tax rates for those affected.
***
***
***
High marginal tax rates of individuals receiving means tested benefits reduces an individual member's incentive to find work and to earn more income through extra work hours.
CBO is indirectly saying that the benefits put into place during the recession and Obama's first term, including tax benefits and subsidies in the new health care law and the temporary reduction in payroll taxes, raised and will further raise marginal tax rates and create incentives not to work. The potential loss of tax credits, subsidies and benefits provide incentives not to find work and increase unemployment, increase part-time employment and lower employment participation rates. These are the effects seen in the current post recession US employment data.
From Congressional Budget Office report, "Effective Marginal Tax Rates for Low- and Moderate-Income Workers:"Working Taxpayers with Income Below 450 Percent of Federal Poverty Guidelines Face a Marginal Tax Rate of 30 Percent, On Average, Under 2012 Law
Some provisions of taxes and transfers, such as statutory income tax rates and federal payroll taxes, affect most workers. (Statutory income tax rates are specified in law and apply to the last dollar of earnings.) Other provisions, such as reductions in tax credits and SNAP benefits, affect fewer people but result in relatively high marginal tax rates for those affected.
- Federal Individual Income Taxes. Under the federal income tax system, workers with income below 450 percent of federal poverty guidelines (commonly known as the federal poverty level, so abbreviated as FPL) face, on average, a marginal tax rate of 11 percent. (Poverty guidelines vary by household size; in 2012, the guideline for a household of four is $23,050.)
- Federal Payroll and State Individual Income Taxes. For most low- and moderate-income workers, payroll taxes cause marginal rates to rise by about 12 percentage points. State income taxes contribute a modest amount to marginal rates, on average.
- Reduction of SNAP Benefits. For recipients, the reduction in benefits that occur as income rises adds an average of 25 percentage points to their marginal tax rates. However, CBO estimates that under 2012 law, only about 18 percent of taxpayers in the group it studied receive SNAP benefits. As a result, SNAP increases marginal tax rates for the group as a whole by only 5 percentage points.
 |
| Source: CBO |
 |
| Source: CBO |
the marginal tax rate for taxpayers in the group CBO studied will rise from 32 percent in 2013 to 35 percent in 2014, on average.
Thursday, November 15, 2012
Eurozone In Recession Again
From Time Business & Money, "Eurozone Back in Recession in Q3" by Associated Press:
The 17-country eurozone has bowed to the inevitable and fallen back into recession for the first time in three years as a sprawling debt crisis took its toll on the region’s stronger economies.*** Official figures Thursday showed that the eurozone contracted by 0.1 percent in the July to September period from the quarter before as economies including Germany and the Netherlands suffer from falling demand.
Tax Hikes Hurt The Economy More Than Equivalent Fiscal Spending Cuts: Chart
From EconLog, "Which hurts more in the short run, tax hikes or spending cuts?" by Garett Jones:
Source: EconLog
Both GDP and consumer spending tell the same story: Spending cuts are the less painful path to fiscal rectitude. When countries tried to get right with the bond markets, this IMF study found that nations that mostly raised taxes suffered about twice as much as nations that mostly cut spending. [Emphasis added.]

President Obama Is Putting Party Over Country
From "Reactions to the President’s press conference" by Keith Hennessey:
It seems like the President is thinking about the threat of tax increases (aka "going over the fiscal cliff") in relative negotiating terms, and not as much in absolute policy terms. That is, his language suggests that he thinks no legislative deal would be worse policy and worse politically for Republicans than it would be for him. If he’s right, then that should give him leverage in the negotiations, because Republicans should be willing to "pay more to avoid that stalemate outcome..
The problem is that he has a responsibility to think about a stalemate not just in relative terms (and especially not just in relative political/blame terms), but also as a matter of absolute policy. No matter who gets blamed for it, a legislative stalemate leads to a terrible short-term macroeconomic consequence: increased unemployment and a new recession, says the Congressional Budget Office. The President’s public posture treats this as if it’s not a big deal because it’s worse for Republicans. Far more importantly, it would be a terrible outcome for the country. [Emphasis added.]
Wednesday, November 14, 2012
Obama's Tax Plan Is a Disaster For The Economy: For Every $1 Obama's Tax Increase Plan Raises, GDP Will Decrease $10: Tax Foundation Study
From The Tax Foundation, "President's $1.6 Trillion Tax Bid Lowers GDP, Wages, Living Standards" by Scott A. Hodge, Stephen J. Entin:
the tax plan would increase federal revenues by $136 billion per year (in 2008 dollars). However, after accounting for the economic effects of the tax increases, fully 70 percent of the expected static revenue gain from the plan would be lost due to the dynamic effects of slower economic growth. For every $1 the plan would raise, GDP would fall by more than $10. That would seem like a poor tradeoff.*** Distributional Affects: Losses in After-Tax Income Across the Board
The loss in GDP and incomes from the president's tax plan would be widely shared. Every income group would experience at least a 2.6 percent decrease in after-tax income from reduced wages and earnings on savings.
Regardless of the initial distribution of a tax change, the economic reactions to a tax increase distribute the economic losses (or gains in the event of a tax decrease) across the board.
Tuesday, November 13, 2012
Money Does Not Buy Elections
From EconLog, "Money Has Little Influence on U.S. Politics" by Garett Jones:
If incumbents won or lost it wasn't because of differences in campaign spending. But in crude regressions, it looked like money mattered for challengers. Now, with fancier regressions, it appears money matters little for challengers as well, especially in well-studied, data-heavy House elections.*** Short version: Too many multi-millionaires lose.
But conventional wisdom, especially among progressives, is that money can buy elections. The Citizens United case was supposed to be the end of democracy since it meant unlimited corporate spending on elections. If money really did buy office, 2012 should have been great evidence for the hypothesis.
Instead 2012 looks like a case study in the powerlessness of money, in the triumph of the autonomous voter. For instance, the Sunlight Foundation reports that 2/3 of outside cash was spent on losers.
Obesity From Night-Eating Without More Calories
From "It’s not just what you eat, but when you eat it" in ScienceBlog:
The Penn studies [in Nature Medicine, Georgios Paschos PhD, a research associate in the lab of Garret FitzGerald, MD, FRS director of the Institute for Translational Medicine and Therapeutics, Perelman School of Medicine, University of Pennsylvania] are surprising in two respects. "The first is that a relatively modest shift in food consumption into what is normally the rest period for mice can favor energy storage," says Paschos. "Our mice became obese without consuming more calories." Indeed, the Penn researchers could also cause obesity in normal mice by replicating the altered pattern of food consumption observed in mice with a broken clock in their fat cells.
This behavioral change in the mice is somewhat akin to night-eating syndrome in humans, also associated with obesity and originally described by Penn’s Albert Stunkard in 1955.*** Daily intake of food is driven by oscillating expression of genes that drive and suppress appetite in the hypothalamus. When the clock was broken in fat cells, the Penn investigators found that this hypothalamic rhythm was disrupted to favor food consumption at the time of inappropriate intake – daytime in mice, nighttime in humans.
When a species’ typical daily rhythm is thrown off, changes in metabolism also happen. For example, in people, night shift workers have an increased prevalence of obesity and metabolic syndrome, and patients with sleep disorders have a higher risk for developing obesity. Also, less sleep means more weight gain in healthy men and women.
Monday, November 12, 2012
US Government Focused On Wrong Small Businesses For Job Creation
From The Wall Street Journal, "Why Washington Has It Wrong on Small Business: For starters, policy makers should ask a simple question: What is a small business, anyway?" by Aaron Chatterji:
Take this simple fact: Small companies create enormous numbers of jobs, but those gains are driven by a handful of startups that actually grow big. Most small businesses start small and stay that way.
Less than a quarter of America's 27 million small businesses have employees. An even smaller portion grow beyond 20 employees. And many of them don't want to. New research from the University of Chicago finds that 75% of small-business owners aren't aiming for growth at all. They're basically just looking for a steady job as their own boss.
Source: The Wall Street Journal *** Yet the government has traditionally placed the neighborhood store and the high-potential startup in the same catchall category. It offers them the same loan programs, counseling services and other assistance. And that means lots of small companies, not to mention the economy as a whole, get shortchanged.
Missing the Distinction
For instance, the government might institute a tax credit for hiring new workers. That's of great importance to a local company like a nail salon that might be on the fence about taking on an employee.
But high-potential startups often aren't as worried about how to pay for workers; they're concerned with finding high-skilled employees, whatever the cost. So they're more focused on issues like immigration reform and science, technology, engineering and math education.

26 Percent Increase In Individual US Income Tax Revenue With Bush Tax Cuts
From The Wall Street Journal, "The Hard Fiscal Facts: Individual tax payments are up 26% in the last two years." by
Tax revenue kept climbing, up 6.4% for the year overall, and at $2.45 trillion it is now close to the historic high it reached in fiscal 2007 before the recession hit. Mr. Obama won't want you to know this, but this revenue increase is occurring under the Bush tax rates that he so desperately wants to raise in the name of getting what he says is merely "a little more in taxes." Individual income tax payments are now up $233 billion over the last two years, or 26%.
Source: The Wall Street Journal
This healthy revenue increase comes despite measly economic growth of between 1% and 2%.*** Note, however, that federal spending remains at a new plateau of about $3.54 trillion, or some $800 billion more than the last pre-recession year of 2007.

Liberals Care About Social Injustice But Their Solutions Do Not Work
From The American Interest Via Meadia, "News From Obama’s Home State" by Walter Russell Mead:
Liberals are right to feel that social justice matters, that the poor should have greater opportunity and that government in a democratic society cannot remain indifferent to the existence of great social evils.Read the entire article.
But where liberals in America have the freest hand—in states like New York, California and Illinois—we see incontrovertible evidence that the policies they choose don’t have the consequences they predict. California by now should surely be an educational, environmental and social utopia. New York should be a wonder of glorious liberal governance. Illinois should be known far and wide as the state that works.
What’s interesting about the governance failures of these states is how comprehensive they are. Other than politicians, union officials and Wall Street investment banks, nobody really benefits from the choices Illinois has made. As the Volker-Ravitch report tells us, even the public sector unions, the architects of many of the state’s most destructive policies, are going to get shafted as a result of the bad policies they’ve supported. They’ve created a state that simply won’t be able to honor its promises to the workers the unions represent.
Sunday, November 11, 2012
Middle Class Spending Does Not Grow Economies: Savings And Private Investment Do: Government Spending Crowds Out And Distorts Job Creation Investment And Lowers The Standard Of Living
From Real Clear Markets, "Obama's Destiny, and The End of Laissez-Faire" by John Chapman:
That is to say, American voters ratified a course set by President Obama and his allies in the political class to purposely lower living standards in the United States in order to level the distribution of income - exactly akin to the welfare states of Europe. Of course their policy aims are not stated so crassly: instead, Mr. Obama talks of a "new security for the middle class", ensuring that "everyone has a fair shot" by all "paying their fair share", and of "building the economy from the middle out" by financing government-directed "investment" in education, energy, health care and infrastructure programs with progressively higher taxes.
In describing this better society, his phraseology is vague if not vacuous, and his quotient of economic literacy in such pronouncements is poor. Economies don't grow via middle class spending, for example; that's an effect, not a cause, of economic growth. Rather, prosperity is engendered via saving and capital investment, as Mises noted. In fact, government-directed spending programs crowd out and distort the very capital allocation that drives efficient job-creating investment, and Mr. Obama's programs are thus in so many ways tantamount to the eating of seed corn, directly leading us to lower living standards in the long run. [Emphasis added.]
Saturday, November 10, 2012
Annual Payments To State And Local Pensions To Close Funding Gap: Totaling $5 Trillion Paid Over 30 Years
From US News, "$5 Trillion Price Tag for Public Pensions" by Philip Moeller:
Here's a look at the authors' estimates of what it would take to close the pension funding gap in each state. Remember that these totals apply to payments required every year for the next 30 years.
Annual Increases to Fund Current State and Local Pensions State Pension Funding
Increases ($billions)Pension Increases per
Taxpayer Household ($)New York $16.9 $2,250 Oregon $3.1 $2,140 Wyoming $0.4 $2,080 Ohio $9.1 $2,051 New Jersey $6.7 $2,000 California $28.3 $1,994 Minnesota $3.9 $1,928 Illinois $9.5 $1,907 New Mexico $1.4 $1,756 Colorado $3.4 $1,739 Pennsylvania $7.5 $1,550 Wisconsin $3.3 $1,522 Connecticut $2.0 $1,459 Michigan $5.3 $1,386 Washington $3.5 $1,371 Alaska $0.4 $1,356 Hawaii $0.6 $1,288 Texas $12.1 $1,271 Missouri $2.9 $1,264 Kentucky $2.1 $1,260 Delaware $0.4 $1,210 Kansas $1.3 $1,197 Massachusetts $3.0 $1,190 South Carolina $2.1 $1,186 Vermont $0.3 $1,163 Mississippi $1.3 $1,127 Louisiana $1.9 $1,118 Virginia $3.2 $1,066 North Dakota $0.3 $1,042 New Hampshire $0.5 $1,010 Nevada $0.9 $884 Nebraska $0.6 $881 Montana $0.3 $872 Alabama $1.6 $868 Iowa $1.0 $861 Oklahoma $1.2 $850 Tennessee $2.0 $837 Maryland $1.8 $818 Florida $5.8 $813 Rhode Island $0.3 $819 Georgia $3.0 $803 North Carolina $2.8 $784 South Dakota $0.2 $776 Maine $0.4 $761 Idaho $0.4 $737 Arizona $1.5 $608 West Virginia $0.4 $600 Utah $0.6 $535 Arkansas $0.6 $534 Indiana $0.8 $329 U.S. Total $163.2 $1,385 Source: Robert Novy-Marx and Joshua D. Rauh
Election Mandate To Hold The Nation Hostage: Obama Willing To Go Over Fiscal Cliff And Increase Unemployment From 7.9 To 9.1 Percent To Appease His Liberal Friends And Raise Taxes On The Rich To Reduce The $1.1 Trillion Yearly Deficit By A Puny 7.5 Percent Or $82 Billion Per Year
From The Wall Street Journal, "The President's Tax Bludgeon: Instead of an olive branch, the President keeps campaigning:" by
on Friday, White House spokesman Jay Carney said the President will veto any bill that includes an extension of the current tax rates for those earning more than $250,000.As CBO said in its analysis, "Economic Effects of Policies Contributing to Fiscal Tightening in 2013," of the effects of allowing the fiscal cliff to occur:*** Congress's Joint Tax Committee estimates that raising taxes on income over $250,000 ($200,000 if you're single) will raise $823 billion over 10 years on a static revenue basis. That includes all revenue from increases in marginal income tax rates, capital gains, dividends, reinstating the phaseouts of deductions for the wealthy and also treating dividends as ordinary income.
That's only $82 billion a year in extra revenue when the federal deficit in fiscal 2012 was $1.1 trillion. So even if Mr. Obama gets his way, his tax increase would only cut the deficit by about 7.5%. And that assumes the tax increase would have no impact on economic growth. If growth slows below its already paltry pace, tax revenue would rise by less than expected despite the higher rates. [Emphahsis added.]
Substantial changes to tax and spending policies are scheduled to take effect in January 2013, significantly reducing the federal budget deficit. According to CBO’s projections, if all of that fiscal tightening occurs, real (inflation-adjusted) gross domestic product (GDP) will drop by 0.5 percent in 2013 (as measured by the change from the fourth quarter of 2012 to the fourth quarter of 2013)—reflecting a decline in the first half of the year and renewed growth at a modest pace later in the year. That contraction of the economy will cause employment to decline and the unemployment rate to rise to 9.1 percent in the fourth quarter of 2013. [Emphais added.]
Friday, November 9, 2012
The Burden Of Public Debt And Its Negative Effect On Private Investment
From Federal Reserve Bank Of Cleveland, Economic Trends, "The Burden of Public Debt" by Owen F. Humpage and Margaret Jacobson:
The overall public-debt burden of the world’s most advanced countries is approaching levels not seen since the Second World War—levels that could damage their future growth prospects. According to International Monetary Fund (IMF) estimates (here and here), the average ratio of public debt to GDP among the advanced economies—their debt burden—will approach 111 percent this year, but then rise significantly above that percentage at least through 2017. The United States’ public debt level is headed for the wrong side of that average. After breaching 107 percent of GDP this year, the U.S. public-debt burden will settle at 114 percent after 2015, according to the IMF’s best guess. While much of the debt buildup stemmed from the ongoing global economic malaise, contingent liabilities associated with aging populations will keep pressure on many advanced countries’ budgets. The outlook is still cloudy, but this much seems clear: To the extent that public debts absorb private savings that otherwise would support private investment, long-term economic growth will suffer. [Emphasis added.]
 |
| Source: Federal Reserve Bank Of Cleveland |
Thursday, November 8, 2012
During Obama's First Term, Rehired Unemployed Face Greater Odds New Jobs Pay Less, With A Third Taking At Least A 20 Percent Pay Cut: Likely A Result Of Obama's Policies
From Federal Reserve Bank Of Cleveland, Economic Trends, "Displaced Workers and the Great Recession" by Murat Tasci:
While causes for the greater chance of a lower wage upon rehire are not discussed in the article, several of Obama's policies likely contributed to the wage loss of rehires:
The Great Recession lasted six quarters, from December 2007 through June 2009.... During the course of the recession, about 7.5 million jobs were lost in the nonfarm business sector. Job losses did not end until February 2010, by which point total jobs lost stood at about 8.7 million. More than two years since then and after three years of growth in the aggregate economy, employment recovered by 4.5 million, still short of the sharp decline we experienced.
*** The cost of displacement can be quite large. Consider the experiences of displaced workers from the 2010 [Displaced Workers Survey (DWS)] release, for instance. Those who were tenured had less than a 50 percent chance of finding a job by January of that year, but those who did find a job were more than likely (by 55 percent) to end up with a job that paid less than their previous wage. An incredible 36 percent of those who found jobs suffered at least a 20 percent wage loss. Prior to the recession, not only were the odds of being reemployed higher (67 percent), but the odds of being paid more relative to the predisplacement wage were much higher too, 55 percent, as opposed to 45 percent in 2010 and 46 percent in 2012. Unfortunately, a significant fraction of the reemployed displaced workers, 33 percent, still reported having suffered at least a 20 percent wage loss in the 2012 survey [Emphasis added.}.
Source: Federal Reserve Bank Of Cleveland
Workers from every industry took a larger hit in terms of significant wage losses (more than 20 percent) in the 2010 survey relative to the prerecession survey in 2008. Some sectors, such as professional and business services and retail trade, took larger hits with the recession. However, they recovered a bit in the 2012 survey, whereas the depth of the wage loss worsened in construction and government. Nevertheless, workers who were displaced from manufacturing and construction industries are among those with the worst wage outcomes according to the 2012 survey, with slightly more than 30 percent suffering at least a 20 percent wage loss.
Source: Federal Reserve Bank Of Cleveland


While causes for the greater chance of a lower wage upon rehire are not discussed in the article, several of Obama's policies likely contributed to the wage loss of rehires:
- Extended unemployment benefits lengthened the time workers remained unemployed and contributed to a loss of skill and a decline in the workers' value to employers.
- Extended food stamp benefits (SNAP) with a loss of the benefit above certain income levels pressured more workers to take lower full-time salaries or to work part-time at a lower wage to continue to receive food stamps.
- The stimulus program which employed people at short lived government funded jobs and which crowded out private investment and the creation of well paying permanent jobs.
- The new health care law, the Affordable Care Act, which adds significant employer costs to the hiring of full-time private sector workers.
Tuesday, November 6, 2012
Congressional Analysis Of Tax Law Changes Is Biased Against Tax Rate Reductions
My comment to the blog, Econbrowser, "The Choice: Math vs. Anti-Math in Fiscal Policy" by Menzie Chinn, Professor of Public Affairs and Economics at the University of Wisconsin, Madison:
Unfortunately, CBO's and JCT's [Congressional Budget Office and Joint Committee on Taxation] methodology is biased against tax and government spending reductions and biased in favor of tax increases and government spending increases. For legislative consistency, CBO uses JCT's analysis of tax law changes in its own analysis of proposed legislation effects.To quote JCT from its own testimony and document (JCX-48-11, Sept 21, 2011) (and JCT has said the same thing for many years):One of the conventions that is followed for both revenue estimates prepared by the Joint Committee staff and expenditure estimates prepared by the Congressional Budget Office is that they are done against a fixed forecast of aggregate economic activity; the Joint Committee staff generally assumes that a proposal will not change total aggregate production and therefore holds forecasted Gross National Product (“GNP”) fixed....the Joint Committee staff generally assumes a fixed GNP forecast;JCT assumes for revenue projections that a tax increase will never reduce aggregate economic activity (GDP) and a tax reduction will never increase aggregate economic activity (GDP): a tax reduction does not produce increased tax revenues from higher GDP and a tax increase does not reduce tax revenue from decreased GDP.Obama's proposals are tailored to game the rules used by JCT and CBO to reflect a Congressional mythical view of the US economy that favors increase in taxes and government spending. Romney's proposal's general concept, which is not modeled by CBO and JCT, is that there are incentives and disincentives reflected in the tax code that increase and decrease economic activity such as private capital investment, workforce participation, work hours, business formations, etc., which have real GDP effects.
Under the current JCT-CBO methodology, reformation of the tax code to provide increased GDP growth through greater private investment incentives, increased workforce participation and increased work hours without losing tax revenue is impossible.
Sunday, November 4, 2012
No Private Sector Wage Growth Post Recession
From The Wall Street Journal Real Time Economics Blog, "Number of the Week: Stagnant Wage Growth" by Jeffrey Sparshott:
U.S. job growth has accelerated, but the bad news is that people who already have jobs aren’t getting raises or more time on the clock.
 |
| Source: The Wall Street Journal |
Side By Side Economic Growth Comparison Of Romney And Obama Tax Plans: 7 Percent GDP Growth Vs 3 Percent GDP Decline
From Tax Foundation, "A Comparison of the Long-Term Economic Effects of the Obama and Romney Tax Plans" by TF Staff:
Tax Foundation economists have published a series of studies that analyze the long-term economic and distributional effects of the tax plans outlined by President Barack Obama and Governor Mitt Romney. These comprehensive assessments were done using the Tax Foundation’s Tax Simulation and Macroeconomic Model which measures how changes in tax policies affect the economic levers that determine economic growth, workers’ incomes, and the distribution of the tax burden.*** As the table indicates, the candidates’ tax plans would have a starkly different impact on the economy. The Romney plan, which would reduce tax rates on individuals and corporations, would increase GDP 7.4 percent over the long run. The Obama plan, which would raise tax rates on individuals, would reduce GDP 2.9 percent over the long run. [Emphasis added.]***
Table 1. Romney vs. Obama, Side-by-SideComparison of the Economic and Budget Effects of Obama and Romney Tax Proposals | ||
Percent or dollar changes in: | Romney | Obama |
GDP (%) | 7.4% | -2.9% |
Private business GDP (%) | 7.8% | -3.0% |
Capital stock (%)* | 18.6% | -7.5% |
Wage rate (%) | 4.7% | -2.3% |
Business hours worked (%) | 2.9% | -0.7% |
Federal revenue (static est., $) | -$336 | $136 |
Federal revenue (dynamic est., $) | -$136 | $41 |
Federal spending ($) | $34 | -$15 |
Deficit (+ = reduction, - = increase, $) | -$170 | $55 |
% Dynamic revenue reflow vs. static est.** | 60% | -70% |
GDP ($) | $1,064 | -$416 |
GDP / $ dynamic tax change*** | $7.82 | -$10.27 |
Note: All dollar figures are in billions of 2008 dollars. These changes represent the cumulative increase or decrease in the permanent level of GDP and other variables after all economic adjustments to the tax changes, taking five to ten years. They are not permanent changes in the annual rates of growth of the variables. The economic model and tax calculator were run at 2008 income levels, and dollar figures are in 2008 dollars. Romney’s plan was modeled according to the candidate’s specified rate structure, including reduced rates on individuals and corporations, but not his unspecified proposals to reduce tax expenditures. See our earlier report for specifics. Obama’s plan was modeled according to his proposed rate structure as presented in the 2013 Federal Budget, including higher rates on individuals and estates. It does not include Obama’s corporate proposals contained in the February White House/Treasury Framework for Business Tax Reform, which suggests a lower corporate rate of 28 percent combined with a number of revenue raisers that largely offset the rate cut. *Private business sector equipment, plant, other buildings and structures, inventory, etc. **Percent of static tax cut recovered (+) due to faster economic growth, or percent of static tax increase lost (-) due to slower economic growth. ***Positive numbers indicate that the government would lose revenue with these cuts, but that economic output (GDP) would rise by the indicated amount for each dollar of revenue lost. Oppositely, negative numbers indicate that GDP would decrease by the indicated amount for each dollar of revenue raised. | ||
 |
| Source: Tax Foundation |
Subscribe to:
Posts (Atom)