Friday, July 26, 2019

US Regional GDP Change: Chart Of Past 4 Quarters

From The Wall Street Journal, "Real Time Economics: The Outlook is Getting ‘Worse and Worse’ " by Jeffrey Sparshott, and Likhitha Butchireddygari, Jul 26, 2019:
For the first time in two years, all 50 states and Washington, D.C., saw an increase in real GDP in the first quarter of 2019. But the Northeast and mid-Atlantic regions have underperformed for the past four quarters, while the Southwest and Rocky Mountain regions have outpaced the country.
***
Source: The Wall St Journal, Real Time Economics

Thursday, July 25, 2019

Gross Domestic Product by State, First Quarter 2019: Map

From US Bureau of Economic Analysis, "Gross Domestic Product by State, First Quarter 2019: West Virginia Had the Fastest Growth in the First Quarter":
Real gross domestic product (GDP) increased in all 50 states and the District of Columbia in the first quarter of 2019, according to statistics released today by the U.S. Bureau of Economic Analysis. The percent change in real GDP in the first quarter ranged from 5.2 percent in West Virginia to 1.2 percent in Hawaii.
Source: US Bureau of Economic Analysis

Friday, July 12, 2019

Over 70 Percent Of Very High (Top 400) Income Earners Are In That Top Tier For Only One Year

The US has a high turnover of people in the very high income brackets. A higher tax on people earning very high incomes affects many more people than elected officials lead us to believe. Over a 22- 23 12-13 year period, 4500 people entered the class of the top 400 earners for at least one year. Fifty percent of income earners are in the top 10 percent for at least one year during their lifetimes. 11 percent will be in the top 1 percent. Any higher tax on the rich will hit many more taxpayers than politicians tell us.

From Tax Foundation, "How Much Turnover Is There Among the Richest Americans?" by Robert Bellafiore and Aida Vazquez-Soto:
As scholars and everyday taxpayers continue to debate this issue and the question of increasing taxes on the richest Americans, one observation to keep in mind is the high degree of turnover among the highest-income Americans.

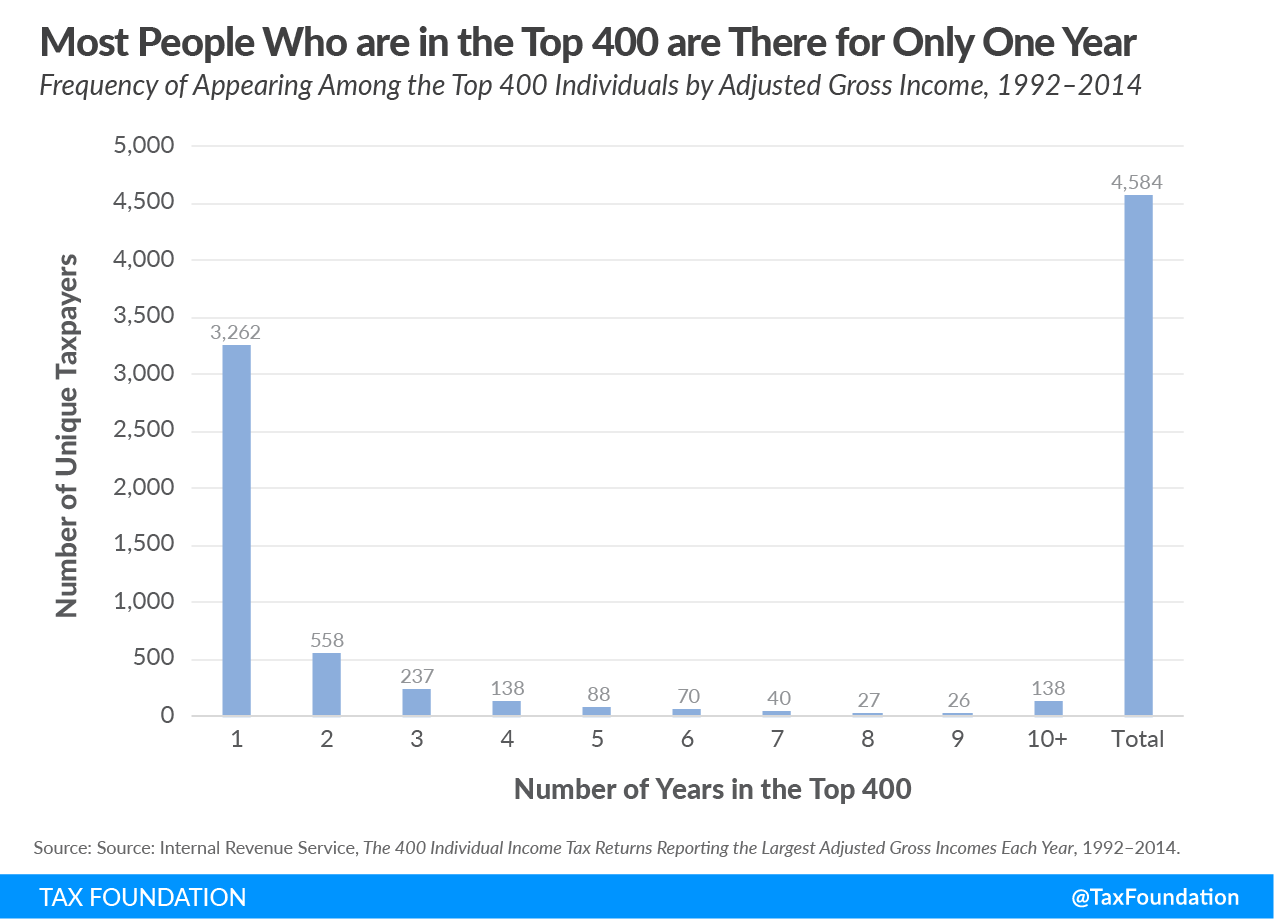
The following chart, using data from the Internal Revenue Service (IRS), shows the frequency of those filing who make the top 400 individual income tax returns with the highest adjusted gross income from 1992 to 2014. Of the 4,584 people who made it into the top 400 at some point over that period, 3,262 qualified for only one year. In other words, 71.2 percent of those who were in the top 400 made it once and not again.
***
Source: Tax Foundation

As The Cato Institute noted, "High Turnover Among America’s Rich" by Chelsea Follett, January 8, 2016:
Your odds of “making it to the top” might be better than you think, although it’s tough to stay on top once you get there.

According to research from Cornell University, over 50 percent of Americans find themselves among the top 10 percent of income-earners for at least one year during their working lives. Over 11 percent of Americans will be counted among the top 1 percent of income-earners (i.e., people making at minimum $332,000 per annum) for at least one year.

How is this possible? Simple: the rate of turnover in these groups is extremely high.

Just how high? Some 94 percent of Americans who reach “top 1 percent” income status will enjoy it for only a single year. Approximately 99 percent will lose their “top 1 percent” status within a decade.

Wednesday, July 10, 2019

Average Household Income Of The Top 1 Percent Was $1.8 Million Before Taxes And Transfers And $1.6 Million After: CBO Report

From CBO, "The Distribution of Household Income, 2016" July, 9, 2019, report:

Source: CBO
What Was the Distribution of Income in 2016 Before Taxes and Transfer Payments?
First, CBO analyzed household income excluding the effects of federal taxes and means-tested transfers (which include benefits from Medicaid, the Supplemental Nutrition Assistance Program, and Supplemental Security Income). According to the agency’s estimates, in that year:
  • Average income among households in the lowest quintile (or fifth) of the income distribution was about $21,000;
  • Average income among households in the highest quintile—that is, the top 20 percent—was about $291,000; and
  • Average income among households in the top 1 percent was about $1.8 million.
Those amounts include social insurance benefits (such as benefits from Social Security and Medicare).

How Did Means-Tested Transfers and Federal Taxes Affect the Distribution of Income in 2016?
Means-tested transfers and federal taxes are both progressive. That is, low-income households receive a larger share of their income as means-tested transfers than do high-income households, and high-income households pay a larger share of their income in federal taxes than do low-income households. Because of the progressive structure of those systems, the distribution of income after transfers and taxes is more even than the distribution of income before transfers and taxes. In 2016, according to CBO’s estimates, those transfers and taxes:
  • Increased income among households in the lowest quintile by $14,000 (or more than 65 percent), on average, to $35,000,
  • Decreased income among households in the highest quintile by $76,000 (or more than 25 percent), on average, to $215,000, and
  • Decreased income among households in the top 1 percent by $600,000 (or more than 33 percent), on average, to $1.2 million.
Not all households receive means-tested transfers. In fact, those transfers went overwhelmingly to low-income households in 2016. Over 50 percent of means-tested transfers went to households in the lowest income quintile, which amounted to 72 percent of income before transfers and taxes for those households. Less than 4 percent of means-tested transfers went to households in the highest quintile, which amounted to less than one-half of one percent of income for those households. Households in all quintiles have some form of federal tax burden, but high-income households paid the majority of federal taxes in 2016. Households in the highest income quintile, which received about 54 percent of all income, paid about 69 percent of federal taxes. The average federal tax rate for those households was about 27 percent. Households in the lowest quintile, which received about 4 percent of all income, paid less than one-half of one percent of federal taxes. The average federal tax rate for those households was less than 2 percent. Households in the top 1 percent of the distribution received 16 percent of income and paid 25 percent of federal taxes; their average federal tax rate was about 33 percent.

What Are the Trends in Household Income and Income Inequality?
According to CBO’s estimates, average household income before transfers and taxes was almost 60 percent higher in 2016 than it was in 1979 in real (inflation-adjusted) terms—reflecting an average growth rate of 1.3 percent per year. That growth, however, was not the same across the income distribution. For the lowest quintile and the middle three quintiles, it was 33 percent (or 0.8 percent per year), but for the highest quintile, it was 99 percent (or 1.9 percent per year). For the top 1 percent of the income distribution, it was 218 percent (or 3.2 percent per year). Because of those differences in growth rates, income inequality was greater in 2016 than it was in 1979 [omitted interactive graphic]. For the lowest quintile, cumulative growth in income after transfers and taxes (85 percent, or 1.7 percent a year) was significantly greater over the period than was growth in income before transfers and taxes (33 percent). That change was due to an expansion of means-tested transfers (especially Medicaid benefits) and a reduction in federal taxes (largely from an expansion of refundable tax credits). By contrast, for the highest quintile, cumulative growth in income after and before transfers and taxes was similar, at 101 percent and 99 percent, respectively. The same was true for the top 1 percent of the income distribution: 226 percent versus 218 percent. Because of the redistributive nature of means-tested transfers and federal taxes, the degree of income inequality was less after transfers and taxes than it was before. Over the 1979–2016 period, the extent to which those policies reduced income inequality increased.

Tuesday, July 9, 2019

Distribution of Household Income, 2016: CBO

From The Congressional Budget Office, July 9, 2019, Report, "The Distribution of Household Income, 2016":
In 2016, average household income before accounting for means-tested transfers and federal taxes was $21,000 for the lowest quintile and $291,000 for the highest quintile. After transfers and taxes, those averages were $35,000 and $214,000.
Source: CBO