... [Harvard Professor] Sharon Inouye ... developed a [delirium] program that hundreds of hospitals have used to reduce cases of the condition by an estimated 40 percent.
... best practices for reducing delirium risk are getting lost in the turmoil of COVID-19 care.
Early data from peer-reviewed studies suggest that one-third of hospitalized COVID-19 patients of all ages, and two-thirds of those with severe disease, show signs of delirium, said Inouye. ...
... patients who experience delirium in the hospital remain hospitalized longer than their peers, have more complications and are more likely to die during their hospital stay or in the following year, need long-term care or develop cognitive impairment, including dementia.*** ... overuse of chemical restraints such as antipsychotics and other sedating drugs. ... when a patient starts to get agitated, providers get scared for the patient’s safety and their own safety and feel they have to sedate the patient. But sedating them is not always needed and leads to many complications. [Emphasis added.]
Thursday, April 30, 2020
One-Third Of COVID-19 Hospitalized Patients Show Signs Of Delirium: Best Practices Not Used In The Turmoil
From ScienceBlog, "One-Third Of Hospitalized COVID-19 Patients Show Signs Of Delirium", April 27, 2020, Harvard University:
Wednesday, April 29, 2020
Decline In Healthcare Spending Caused Half The Drop In First-Quarter GDP: The Irony Of Crowded Hospitals, Overworked Doctors And Much Less Healthcare For Everyone Else
From The Wall Street Journal, Real Time Economics, "Newsletter Special Edition: The Expansion Is Over" by Jeffrey Sparshott:
Personal consumption of services was less than 30% of GDP in 1957 and 1968. Services now dominate our economy, contributing 47% of GDP last year, and they have borne the brunt of social distancing. Services consumption, from travel to restaurants to doctors’ visits, tumbled 10.2%, annualized, in the first quarter, accounting for roughly all the net decline in quarterly output. Unlike goods, services can’t be stored in inventory and are seldom imported, so almost every dollar not spent on services comes straight out of Americans’ incomes. —Greg Ip
*** Perhaps surprisingly, healthcare spending accounted for nearly half the drop in first-quarter GDP. Yes, the world is in the middle of a healthcare crisis. In all likelihood, consumers are putting off—or unable to schedule—elective and other apparently nonurgent procedures.
 |
| Source; The Wall St Journal, Real Time Economics |
Tuesday, April 28, 2020
As Many Extra Non-Covid Deaths As Covid Deaths Occurred During Height Of Epidemic: Did Hospitalization Restrictions On Treating Non-Covid Illnesses, Social Isolation, Job Losses And Business Closures Increase Deaths?
A Washington Post article (excerpted below) indicates that there were an estimated 15,400 excess deaths from March and through April 4, only half of which are attributable to Covid-19.
From The Washington Post, "U.S. deaths soared in early weeks of pandemic, far exceeding number attributed to covid-19: An analysis of federal data for the first time estimates excess deaths -- the number beyond what would normally be expected -- during that period." by Emma Brown, Andrew Ba Tran, Beth Reinhard and Monica Ulmanu:
From The Washington Post, "U.S. deaths soared in early weeks of pandemic, far exceeding number attributed to covid-19: An analysis of federal data for the first time estimates excess deaths -- the number beyond what would normally be expected -- during that period." by Emma Brown, Andrew Ba Tran, Beth Reinhard and Monica Ulmanu:
 |
| Source: Washington Post |
In the early weeks of the coronavirus epidemic, the United States recorded an estimated 15,400 excess deaths, nearly two times as many as were publicly attributed to covid-19 at the time, according to an analysis of federal data conducted for The Washington Post by a research team led by the Yale School of Public Health.
The excess deaths — the number beyond what would normally be expected for that time of year — occurred during March and through April 4, a time when 8,128 coronavirus deaths were reported.
The excess deaths are not necessarily attributable directly to covid-19, the disease caused by the coronavirus. They could include people who died because of the epidemic but not from the disease, such as those who were afraid to seek medical treatment for unrelated illnesses, as well as some number of deaths that are part of the ordinary variation in the death rate. The count is also affected by increases or decreases in other categories of deaths, such as suicides, homicides and motor vehicle accidents. [Emphasis added]
Monday, April 27, 2020
Coronavirus Data Is Missing A Baseline Mortality Rate For Those With And Without Covid-19
My posted comment to The Wall Street Journal, "Do Lockdowns Save Many Lives? In Most Places, the Data Say No: The speed with which officials shuttered the economy appears not to be a factor in Covid deaths." by TJ Rodgers:
The data is missing a baseline comparison. For a long time, the only people tested were those who has [had] symptoms similar to Covid-19, fever, etc. The number of Coronavirus cases of those tested is about 19 percent. The overall US death rate of those who tested positive is about 5.5 percent. Old people with secondary illnesses are the bulk of the 5.5 percent deaths. The symptomatic 81 percent, the negatives, did not have Covid-19. What was their death rate? Did seniors with secondary illnesses who tested negative for Covid-19 die at the same or greater rate than those who tested positive for Covid-19? We do not know. If the death rates of ill seniors with and without Covid-19 are not substantially different, why the hysteria and focus of all our attention on the Coronavirus? For example, seniors can die of pneumonia. Is there a difference if it is Covid-19 pneumonia or not a Covid-19 pneumonia? Probably only for politicians, mass media and medical reimbursement.
Wednesday, April 22, 2020
Cars And Trucks Are 40 Percent Of Oil Demand: Chart
From The Wall Street Journal, "The Daily Shot: Jet Fuel, Heating Oil at Levels Not Seen Since After 9/11" by Lev Borodovsky:
 |
| Source: The Wall St Journal, The Daily Shot |
Tuesday, April 21, 2020
Did Epidemiologists Grossly Underestimate The Public's Willingness And Ability To Reduce Daily Social Contacts?
From Gallup, Gallup Blog, April 21, 2020, "Americans' Social Contacts During the COVID-19 Pandemic" by Jonathan Rothwell:
Adults practicing social distancing generate at least 90% fewer contacts per day than those who are making little effort to social distance, according to new Gallup data. Those who completely or mostly isolate themselves generate about five contacts per day, compared with an average of 52 for those not attempting to isolate themselves.*** Yet, closing workplaces may not be the only way to mitigate contact and suppress viral transmission. Workers who visit their work site but have made changes in how they do their job reduced contacts by 29% to 69%.
Why Measuring Contacts Matters
In epidemiological models, social distancing has large effects on expected infection growth. Yet, different modeling teams have used varying assumptions for the efficacy of social distancing when it comes to reducing contacts. Getting these estimates right would thus appear crucial to accurately understanding the risks and rewards of different mitigation policies.
For example, in research published by public health scholars at Columbia University (PDF download), these scholars have assumed that social distancing can reduce at most 40% of daily contacts. An influential model from Imperial College London defined "social distancing of the entire population" as reducing workplace contacts by 25%, household contacts by 25%, and social or nonwork contacts by 75%.*** Only 3% of adults and 4% of workers have not made any attempt to isolate themselves.
Largest State Unemployment Fund Declines: Chart
From The Wall Street Journal, Real Time Economics, "Newsletter: States Burn Through Unemployment Funds" by Jeffrey Sparshott:
And nearly half of all U.S. states have logged double-digit percentage declines in their trust-fund balances since the end of February, the month before the pandemic triggered shutdowns that led to widespread job losses, Sarah Chaney reports.
States use trust funds to pay regular unemployment benefits, while the extra $600 payments recently added for workers laid off during the pandemic are funded through a federal stimulus package.
 |
| Source: The Wall St Journal, Real Time Economics |
Friday, April 17, 2020
Comparison: 2017-18 Flu Season: 61,000 US Deaths Vs Covid-19 35,500 Deaths: 65+ Seniors Were 83 Percent Of Flu Deaths (50,900, 65+ Flu Deaths)
Will the US and State governments close businesses, order wearing face masks and require social distancing during the next H3N2 Flu epidemic?
From Centers for Disease Control and Prevention (CDC), "2017-2018 Estimated Influenza Illnesses, Medical visits, Hospitalizations, and Deaths and Estimated Influenza Illnesses, Medical visits, Hospitalizations, and Deaths Averted by Vaccination in the United States":
From STAT, a December 22, 2017, article about the severity of that season's H3N2 flu strain and social gatherings spreading the flu, "Happy holidays? Flu season is raging and family gatherings may make it worse" by Helen Branswell:
From Centers for Disease Control and Prevention (CDC), "2017-2018 Estimated Influenza Illnesses, Medical visits, Hospitalizations, and Deaths and Estimated Influenza Illnesses, Medical visits, Hospitalizations, and Deaths Averted by Vaccination in the United States":
CDC estimates that the burden of illness during the 2017–2018 season was high with an estimated 45 million people getting sick with influenza, 21 million people going to a health care provider, 810,000 hospitalizations, and 61,000 deaths from influenza (Table 1). The number of cases of influenza-associated illness that occurred during 2017-2018 was the highest since the 2009 H1N1 pandemic, when an estimated 60 million people were sick with influenza.New York State, which has the bulk of US coronavirus cases, has about 51,000 cumulative hospitalizations in total compared to the past 2017-18 flu season national total of 810,000 hospitalizations.
*** ... 67% of hospitalizations occurred in older adults aged ≥65 years. Older adults also accounted for 83% of deaths, highlighting that older adults are particularly vulnerable to severe disease with influenza virus infection.
From STAT, a December 22, 2017, article about the severity of that season's H3N2 flu strain and social gatherings spreading the flu, "Happy holidays? Flu season is raging and family gatherings may make it worse" by Helen Branswell:
That means lots of people will be sick over the holidays; lots already are. And the multi-generational family gatherings that are part and parcel of the holidays will fuel the spread of the nasty virus.*** This year could well be a severe year. The viruses causing most of the illness right now are from an influenza A family called H3N2. Those viruses are especially hard on older people and H3 seasons generally are more severe that seasons when H1N1 or influenza B viruses are dominant.
Unfortunately the H3N2 component of the flu shot is an under-performer, often offering protection that is in the 30 percent range. (The other components more commonly offer between 50 percent and 70 percent protection.) So even people who have been vaccinated may find themselves coming down with flu, [Dr. Daniel] Jernigan said.
Wednesday, April 15, 2020
Private Sector Employment By Firm Size: Chart
From E21, "Covid-19 Accelerates Small Businesses’ Woes" by Allison Schrager:
 |
| Source: Manhattan Institute Via E21 |
... They [small businesses] traditionally were an engine of innovation and job creation, but in recent years they become a smaller part of the economy. They still employ many Americans but not as many as they used to.
Tuesday, April 7, 2020
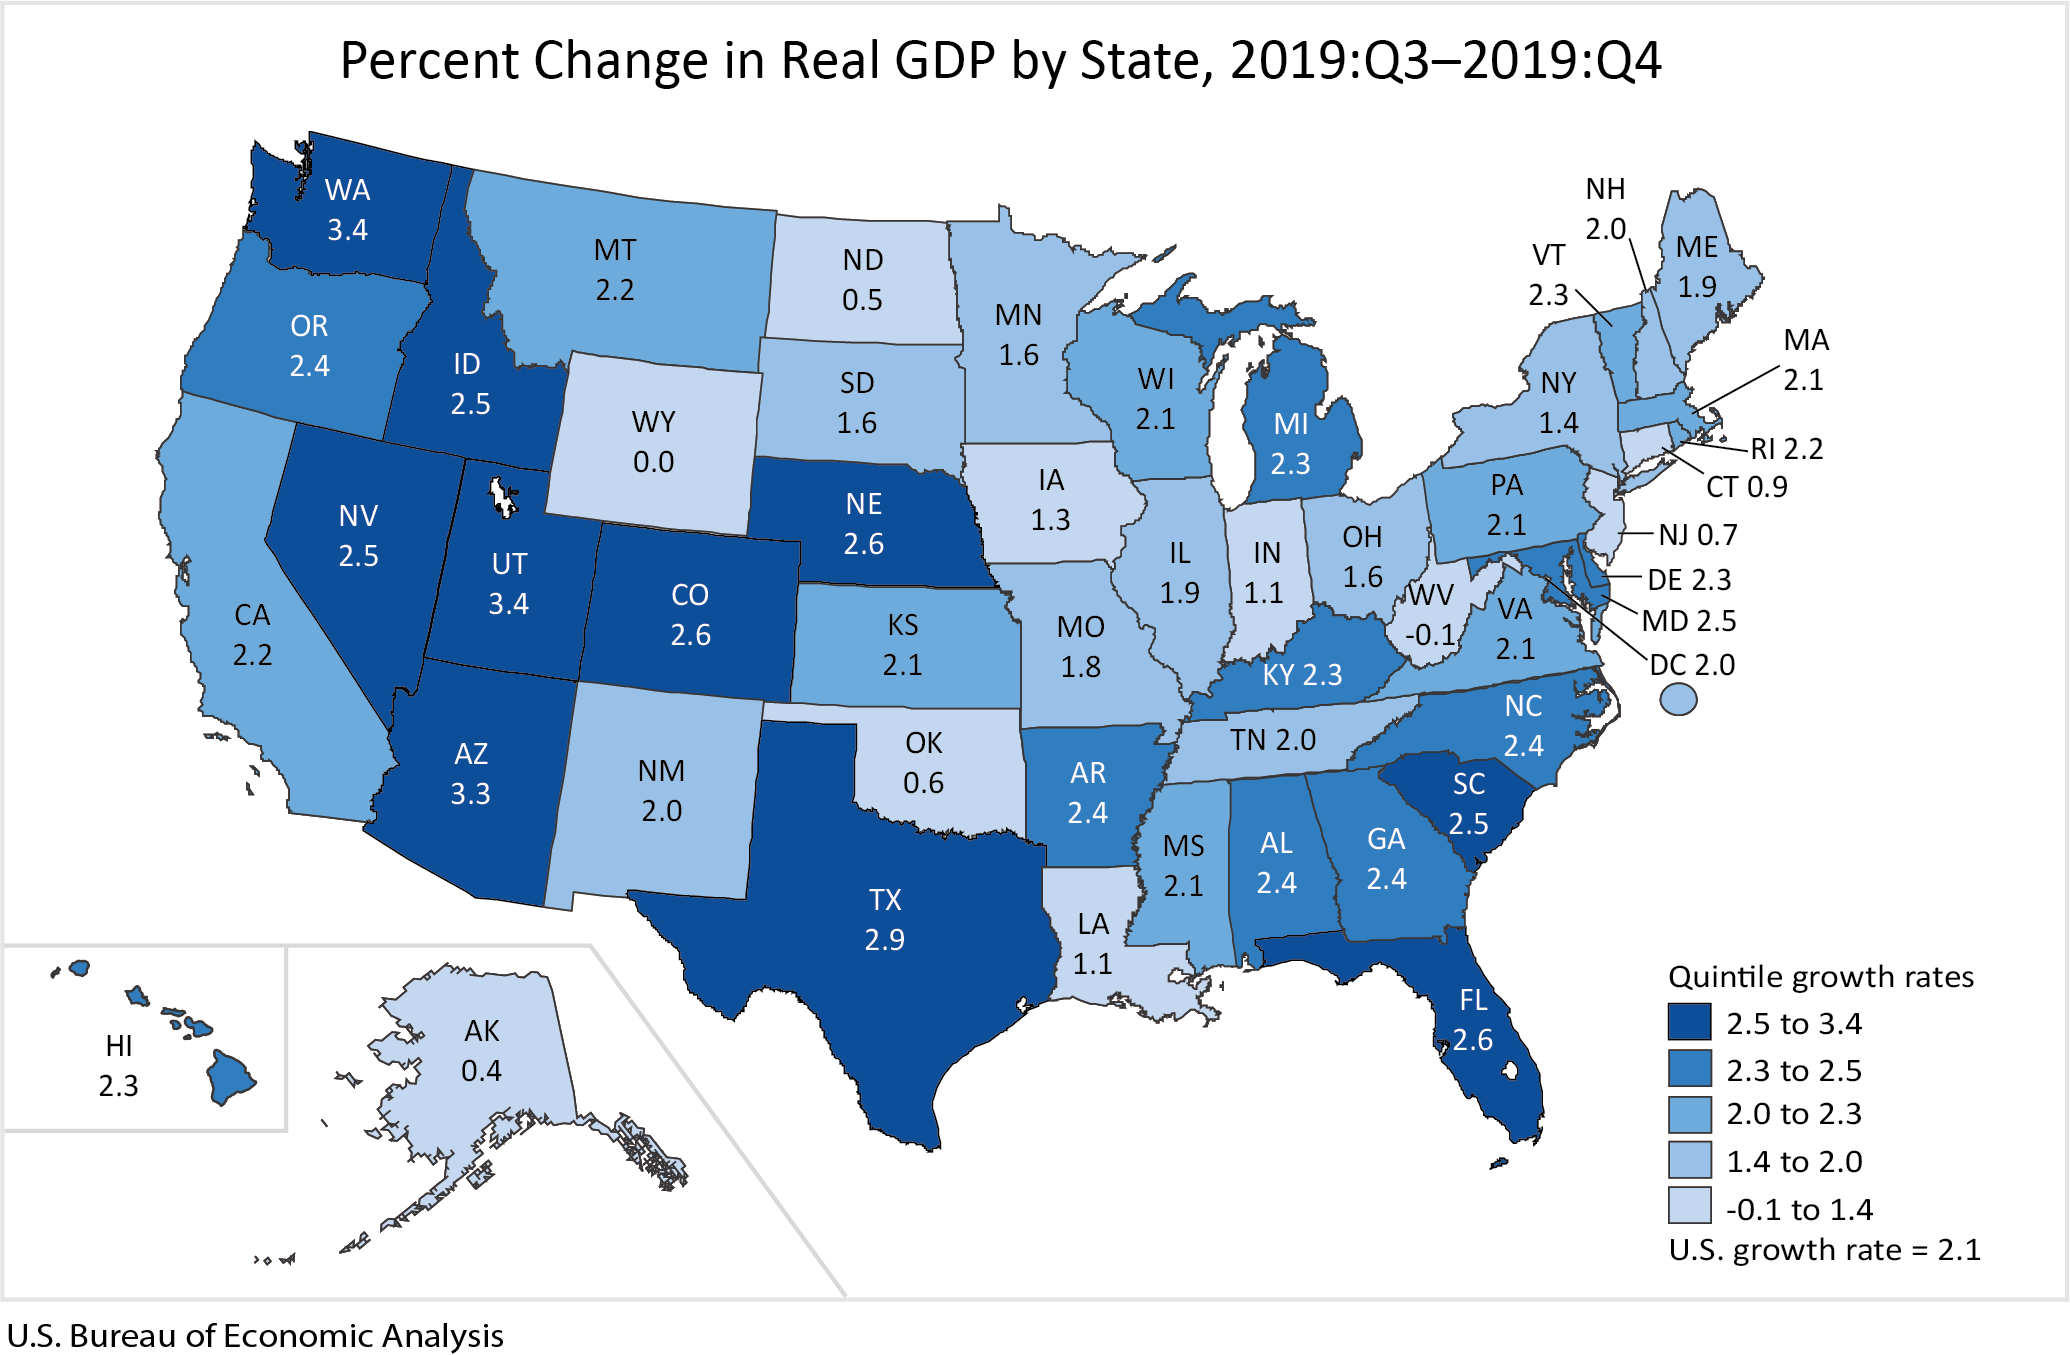
Gross Domestic Product By State: 4th Quarter And Annual 2019
From US Bureau of Economic Analysis, News Release, "Gross Domestic Product by State: 4th Quarter and Annual 2019" (or PDF with tables):
***
Real gross domestic product (GDP) increased in 48 states and the District of Columbia in the fourth quarter of 2019, according to statistics released today by the U.S. Bureau of Economic Analysis. The percent change in real GDP in the fourth quarter ranged from 3.4 percent in Washington and Utah to -0.1 percent in West Virginia.
 |
| Source: Bureau of Economic Analysis |
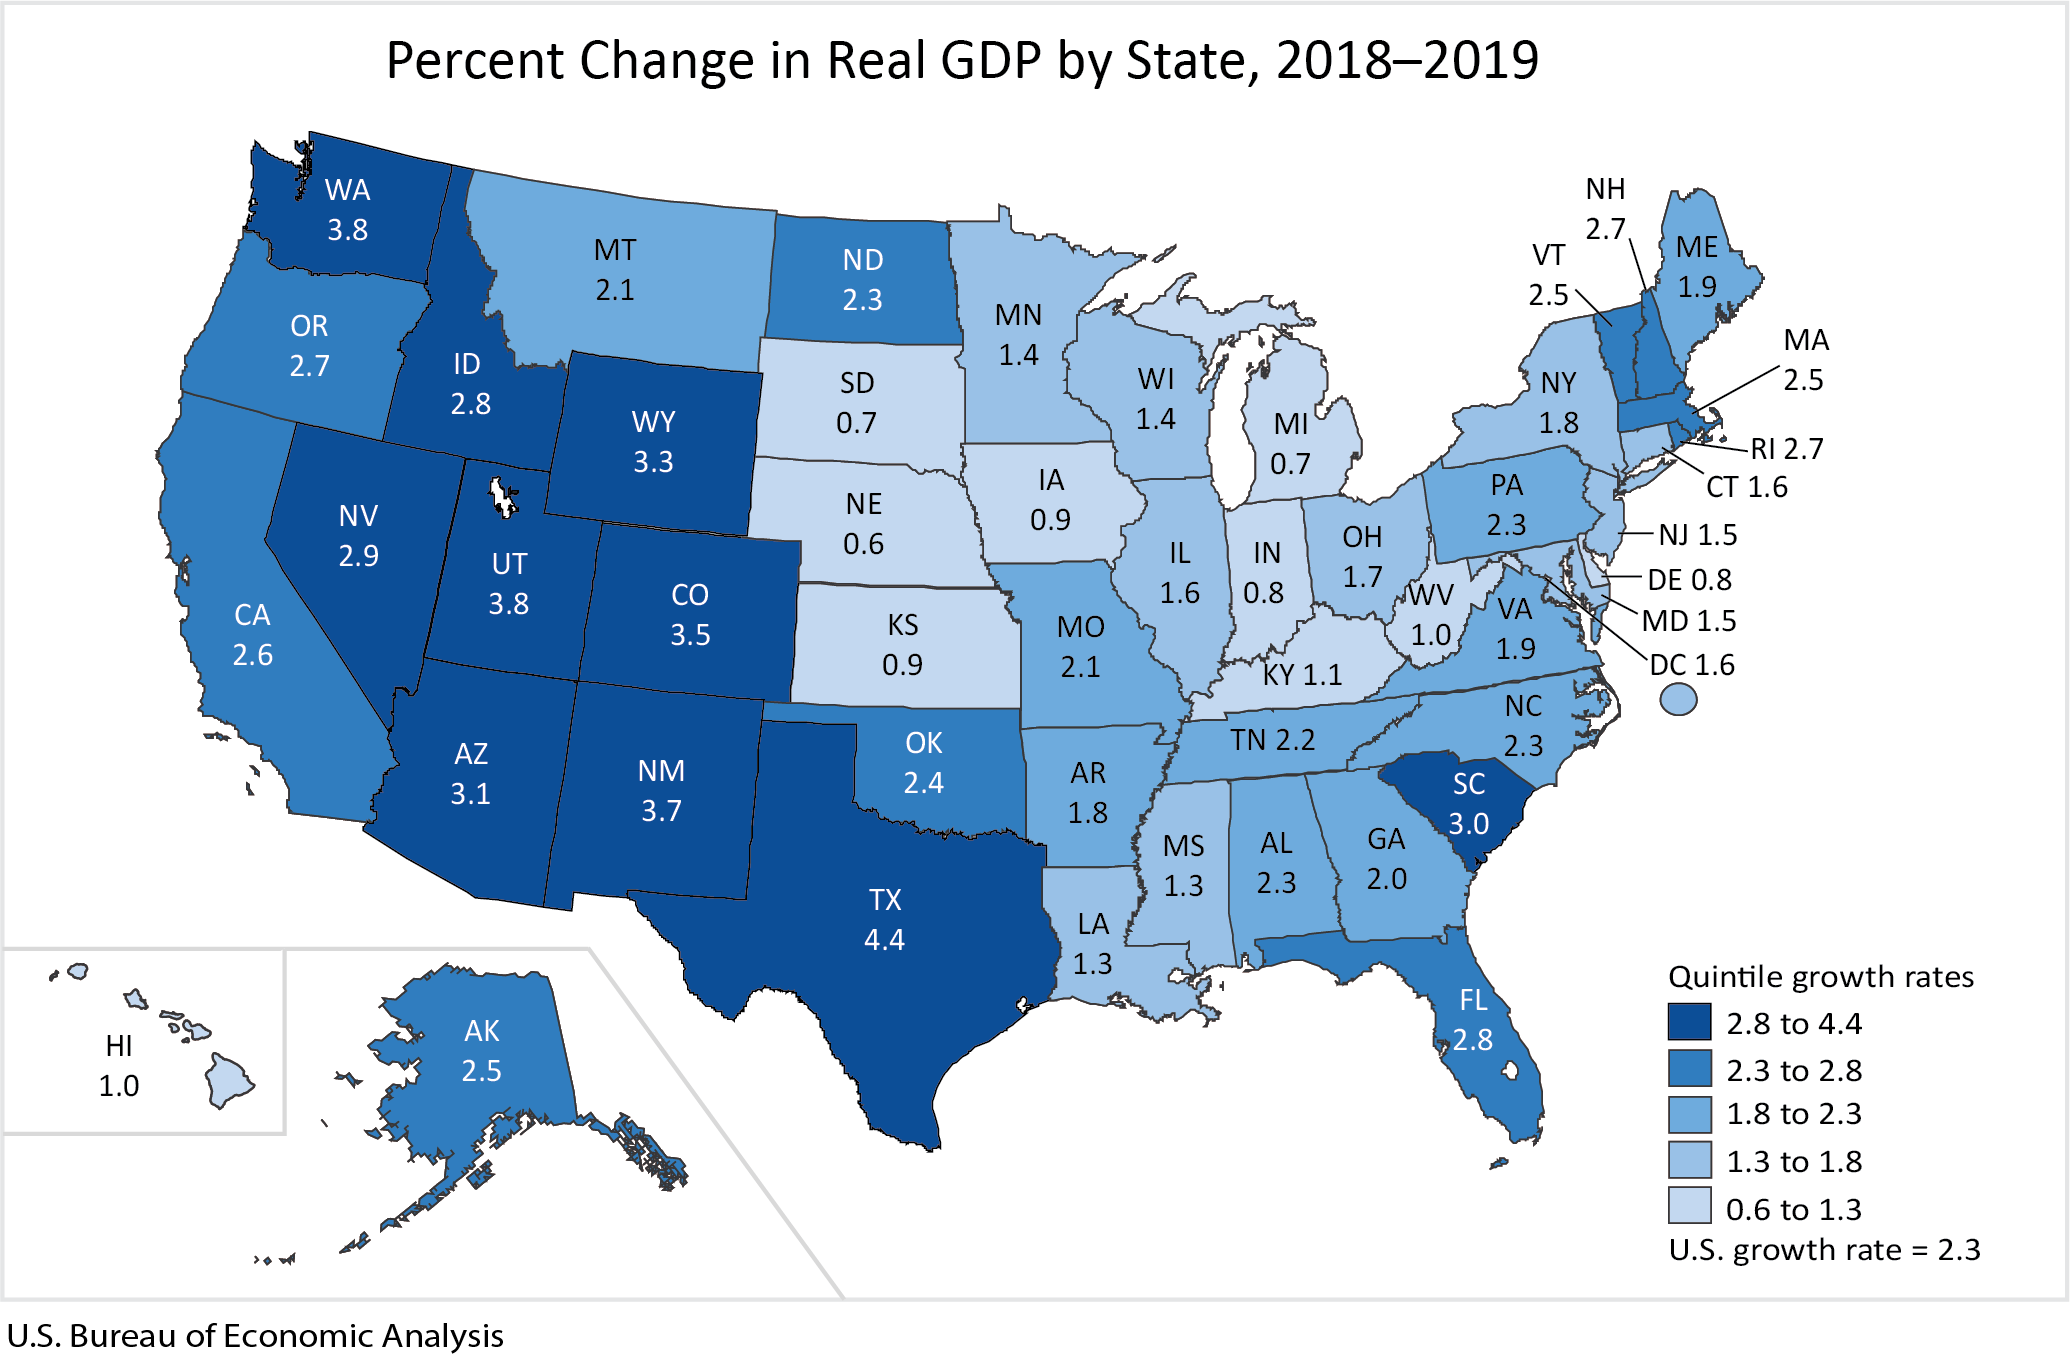
GDP by State, Annual 2019
Real GDP increased in all 50 states and the District of Columbia in 2019. The percent change in real GDP ranged from 4.4 percent in Texas to 0.6 percent in Nebraska.
 |
| Source: Bureau of Economic Analysis |
Monday, April 6, 2020
NYS Coronavirus COVID-19 Deaths BY Age Group
From Daily Voice, "COVID-19: New Data On Deaths By Age Group, County Released By New York State" by Joe Lombardi:
 |
| Source: Daily Voice |
New data on the number of deaths in New York due to the novel coronavirus (COVID-19) by age group and county has been released by the state health department.
The age group with most of the state's 4,159 COVID-19 deaths is 70 to 79 with 1,096 (26.3 percent). It's followed closely by the 80-89 age group with 1,076 (25.8 percent).
Subscribe to:
Posts (Atom)