Some people thought it [High Yield, aka Junk, Bond Market] was a sham, it's rigged. Now it's a trillion-dollar market. It's anything but a sham.
Source: BloombergBusiness
Thursday, December 31, 2015
High Yield Bond Market Since Milken And Drexel
From BloombergBusiness, "Renegades of Junk: The Rise and Fall of the Drexel Empire: The people who lived through Michael Milken's Wall Street saga tell it in their own words, 25 years later" by Max Abelson, Jason Kelly, and David Carey:

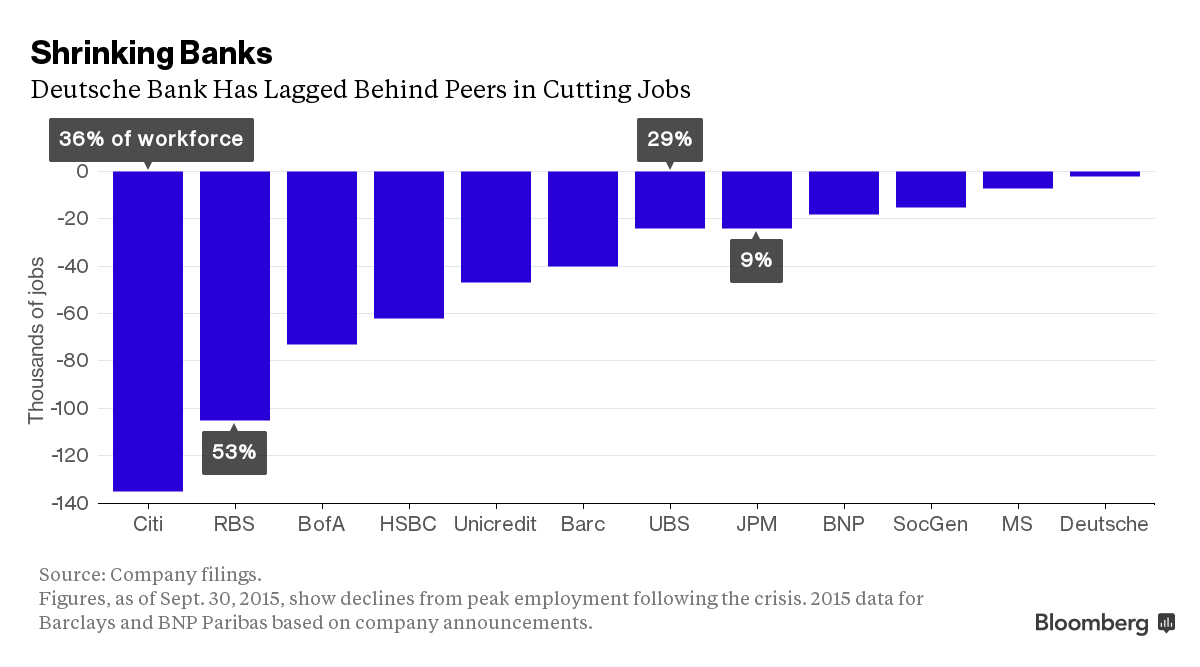
Banks Have Cut Over A Half Million Jobs Since 2008
From BloombergBusiness, "Half a Million Bank Jobs Have Vanished Since 2008 Crisis: Chart" by Yalman Onaran:
Source: BloombergBusiness
Announced cuts in the fourth quarter total at least 47,000, following 52,000 lost jobs in the first nine months of 2015. That would bring the aggregate figure since 2008 to about 600,000. UniCredit SpA says it will eliminate about 18,200 positions. Citigroup Inc., which has reduced its workforce by more than a third, plans to eliminate at least 2,000 more jobs next year.
Wednesday, December 30, 2015
Domestic US Net Migration Among States And Regions: The South Attracts The Most People From Other Regions: The Northeast Is Losing The Most People
From The Washington Post, "The states people really want to move to — and those they don’t" by Emily Badger and Darla Cameron:
Source: The Washington Post ***
Source: The Washington Post
Several long-term trends dating as far back as the 1960s are behind this larger pattern. The rise of air conditioning and interstate highways have made once-sleepy (and sweltering) Southern cities more appealing. And, over the same time, the decline of industrial jobs in the Midwest and Northeast have pushed people out. Cheap housing during the boom years also drove growth in states such as Arizona and Nevada.
For states like New York, domestic migration losses are offset by new immigration from abroad. But for many places in the Rust Belt, these shifts will mean more empty houses and "shrinking cities," and less political might.


Sunday, December 13, 2015
The Fairness Of Preferential Admissions To Colleges
A re-posting of a comment I wrote back in 2010 on opportunity and outcome fairness.
I do not think three people could agree on what "fairness" means.
In golf and horseracing, there is handicapping, which is an attempt to remove beginning advantages to give all an equal chance of winning.
In the US, philosophically, we want to believe that all groups are capable of the same results, i.e. the same percentage of doctors, lawyers, police officers, firefighters, millionaires, successful entrepreneurs, CEOs, college graduates, homeowners, etc.
If one believes handicapping is "fair" to undo socio-economic or competitive disadvantages, then group outcomes should be statistically equal. For these believers, unequal outcomes at the group level indicate ineffective handicapping. It indicates a need to improve the "fairness" of the handicapping process to produce equal outcomes.
If one believes, "equal treatment" [equal opportunity] does not allow for handicapping, does not include school admission preferences, affirmative job action, remedial help, extra time on tests, etc., then equal outcomes will not occur because family socio-economic status predicts many of the outcomes and groups sort by socio-economic status in the US.
Different people can disagree whether "fairness" of equal treatment includes "handicapping".
[Subgroup Versus Whole Group Preferential Treatment And Outcomes]
There is also often a failure to distinguish the characteristics of the subgroup at the hiring or acceptance level from the characteristics of the whole group, and we often focus on subgroup "fairness" in place of group "fairness".
For example, suppose two groups, A and B, are very similar, except the top ten percent of Group A want to become lawyers and the top ten percent of Group B want to become doctors. What is a fair outcome at the top medical schools and top law schools?
By measurements of skills, test scores, grades, etc, we should expect more Group A's to be admitted to top law schools than Group B's. Additionally, we should expect more Group B's to be admitted to top medical schools than Group A's. Should medical and law schools allow the disparate outcome or should they equalize their admission rates for Groups A and B?
Different religions, race, country of origin, socio-economic status etc. groups rank careers and other aspirations differently and those rankings within the groups will sort each group differently. If one group ranks firefighting as a career over retail store management and the other group ranks retail store management higher, is it fair to want each job category to contain the same percentage of each group? Are the gate keeping tests and hiring processes that result in different outcomes "unfair" when group career preferences differ? Is it "unfair" if different career choices have different total life earnings effects?
Saturday, December 12, 2015
Post Recession UK Employment Rates Higher After British Austerity Than US Employment Rates After US Healthcare Reform
From supply and demand (in that order), "Fiscal Policies and the Prices of Labor: A Comparison of the U.S. and the U.K." by Casey B Mulligan:
Many countries of the world experienced an unusually deep and long recession after 2007. Over the same time frame, several facets of fiscal policy were changed, especially policies related to taxation and safety net programs. The purpose of this paper is to compare changes in fiscal policy parameters as they affected the incentives of middle-class Americans and British to be employed. The U.K. had a "stimulus programme" followed by an "austerity programme." The U.S. federal government also passed what it called a "stimulus package," followed by a major health reform.*** The evolution of employment has also been different in the two countries. Figure 1 displays an index of each country’s employment rates for prime-aged people. Employment fell sharply in both countries during the crisis, although less so in the U.K. The U.K. employment recovery began earlier, and by the end of 2014 the U.K. employment rate had exceeded pre-crisis levels.***
Source: supply and demand (in that order) blog

Friday, December 11, 2015
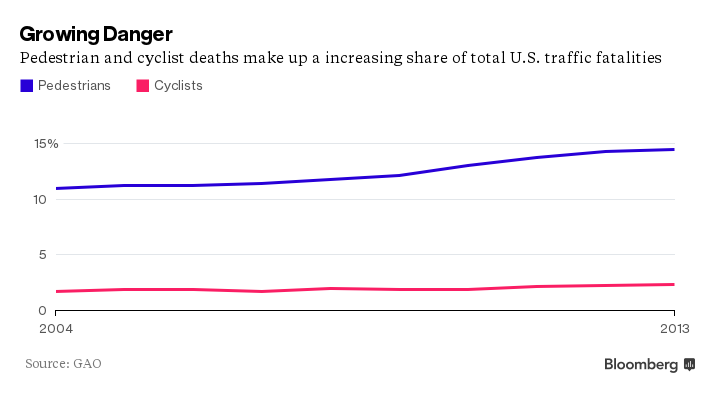
One-Third of Pedestrians And One-Fifth Of Cyclists Who Died In Traffic Accidents Were Alcohol Impaired
From BloombergBusiness, "More American Pedestrians and Cyclists Are Getting Killed on the Roads: What's really happening is that overall traffic deaths have fallen sharply, while pedestrian and cyclist deaths have remained flat." by Patrick Clark:
Source: BloombergBusiness
Pedestrians accounted for 14 percent of traffic deaths in 2013, according to a report released Thursday by the Government Accountability Office, up from 11 percent in 2004. For cyclists, those figures increased from 1.7 percent in 2004 to 2.2 percent in 2013. What's really happening in the chart above is that overall traffic deaths have fallen sharply, from about 43,000 in 2004 to about 33,000 in 2013, while pedestrian and cyclist deaths have remained flat.*** [H]ere's some information that the GAO report turned up from the National Highway Traffic Safety Administration's Fatality Analysis Reporting System:
- 69 percent of pedestrian victims and 87 percent of cyclists were men.
- Most of the deaths occurred between 3 p.m. and midnight.
- One in three pedestrians and one in five cyclists had a blood-alcohol content of more than .08, which is considered alcohol-impaired in all 50 states. [Emphasis added.]
Monday, December 7, 2015
CBO Estimates ACA To Reduce Labor Force Participation By 2 Million Full-Time Equivalent Workers By 2025
From Congressional Budget Office, "How CBO Estimates the Effects of the Affordable Care Act on the Labor Market: Working Paper 2015-09" by Edward Harris, Tax Analysis Division, Congressional Budget Office and Shannon Mok, Tax Analysis Division, Congressional Budget Office:
Summary*** CBO’s current estimate of the ACA’s effect on the labor supply in 2025 is the sum of several components
(see Table 1) [Table omitted.]:The projected reduction in the labor supply would occur in several ways. Some people would choose to work fewer hours; others would leave the labor force entirely or remain unemployed for longer than they otherwise would. CBO did not split its estimate of the overall reduction into the reduction in the number of hours worked and the reduction in labor force participation, because in formulating its estimate, the agency generally relied on labor supply elasticities (which measure the change in the labor supply resulting from a change in tax rates) that combined those two decisions. CBO did, however, translate the reduction in the labor supply into an effect on full-time-equivalent employment. The labor force is projected to be about 2 million full-time-equivalent workers smaller in 2025 than it would have been otherwise. [Emphasis added.]
- Health insurance coverage expansions—comprising exchange subsidies, rules governing health insurance, and an expansion of the Medicaid program—are together expected to reduce the labor supply by 0.65 percentage points.
- The HI surtax is expected to reduce the labor supply by 0.12 percentage points.
- Other major provisions—a penalty on larger employers that do not offer insurance coverage, an excise tax on certain high-premium insurance plans, and a penalty on certain individuals who do not obtain coverage—are together expected to reduce the labor supply by 0.10 percentage point.
Possibility That Global Greenhouse Emissions Have Peaked And May Be Starting A Long-Term Decline
From The New York Times, "Period of Soaring Emissions May Be Ending, New Data Suggest" by Justin Gillis and Chris Buckley:
Industrial emissions of greenhouse gases rose only slightly in 2014 and appear to be on track to decline in 2015, according to new data that raise the possibility that a period of rapid global emissions growth may be coming to an end.
The decline of 0.6 percent projected for this year, should it come to pass, would be highly unusual at a time when the global economy is growing. The projection contrasts sharply with emissions growth that averaged 2.4 percent a year over the last decade, and sometimes topped 3 percent.The new figures were released at the climate conference here by the Global Carbon Project, a collaboration that studies emissions, and published simultaneously in the journal Nature Climate Change.
*** The new figures suggest that there is a chance that global emissions have already peaked and may be starting a long-term decline, experts said Monday, which would be an important inflection point for the international effort to limit the risks of global warming. [Emphasis added.]
Change In Average Hourly Earnings By Industry Since 2013
From The Wall Street Journal, Real Time Economics, "Wages Are Growing 2.3%, But Your Paycheck Probably Isn’t" by Eric Morath:
Consistent job growth is supporting steadier paycheck gains, but raises are uneven and concentrated in high- and low-wage jobs.
Source: The Wall Street Journal
Wage gains at the high end and low end of the spectrum are growing well faster than the 4.5% advance for all private-sector workers since November 2013. Meanwhile, typically middle-class jobs such as those in manufacturing, transportation and education and health services are growing at a substandard pace.

Friday, December 4, 2015
Obama's Ideological Belief In Social Movement Theory Prevents The US from Effectively Responding To Extremist Violence And Threats
From The Council on Global Security, WHITE PAPER, "The Flawed Science Behind America’s Counter-Terrorism Strategy" by Katharine C Gorka:
Executive SummarySocial Movement Theory sees perpetrators of violence and terrorism as victims who are justifiably responding to unjust and unfair political, institutional, cultural, sociological, and economic causes. The movement focuses are responding to the hypothetical causes to prevent future terrorism instead of denouncing the legitimacy of and focusing on the actual violence perpetrated and using punishment and deterrence to prevent future extremist violent acts.*** President Barack Obama and a number of his top counter-terrorism advisors see Islamic extremism through the lens of Social Movement Theory, according to which extremists are viewed as “activists” with legitimate grievances, whether against colonialism, modernism, poverty and unemployment, or simply "the West."
As a result, Obama’s CT strategy has focused primarily on targeting individual perpetrators and addressing "upstream causes," rather than on countering an ideology that is at war with the United States.
Moreover, if you see economic or political grievances at the root of all terrorism, you must then set yourself a course of solving all of those grievances.*** Social Movement Theory and the Presidency of Barack Obama
Social movement theory seeks to understand the origins and consequences of collective mobilization. It had its origins in the socialist labor movements of the 1800s, and interest in social movement theory was revived and reborn with the social protest movements of the 1960s. Given its grounding in these periods of Marxist or socialist-inspired uprisings, it is not surprising that implicit in social movement theory is a perspective that sees the world divided between the owners of production and the workers, exploiters and exploited, slaves and masters.*** This perspective is reflected in the Obama administration’s view of Islam:*** Social Movement Theory and Islamic Activism
While it was President Obama who elevated to national policy the notion of legitimate Muslim grievances as the explanation for terrorism, the idea had been incubating for nearly twenty years. Recasting Islamist extremism as "Islamic activism" began around 1984 with academics who were concerned with what they saw as the relationship between "cultural imperialism" and "Islamic movements". [Footnotes omitted.]
Land Use Regulations Have Increased Since 1970s: Raising Home Prices More Than Costs: Decreasing Affordability And New Apartment Construction: Increasing Sprawl: Exacerbating Housing Bubbles: Reducing Productivity
From BloombergView, "Your Landlord Is a Drag on Growth" by Noah Smith:
... U.S. Jason Furman, the chairman of the Council of Economic Advisers, gave a recent speech to the Urban Institute in which he .... noted that Americans are moving much less than they used to, and are also switching jobs less frequently.*** Since the late 1970s, land-use regulation has skyrocketed in the U.S. That has caused housing prices to go up at a much faster rate than construction costs -- something sure to please existing homeowners, but which locks potential homeowners out of the market. The more zoned a city is, the less affordable it tends to be. Bloomberg View’s Justin Fox recently reported on how many fewer apartments are built these days. Undoubtedly, much of that is due to stricter land-use regulation.*** Furman shows that states with more constrained housing supply have seen much slower income convergence between different cities. That strongly implies that land-use restrictions are effectively keeping people penned up in bad locations.
Of course, this is in addition to the other problems that zoning causes, such as the environmental costs of sprawl, the potential exacerbation of housing bubbles, and the productivity drag from reduced density.
Thursday, December 3, 2015
Electric Car Batteries Lose More Than Half Their Range In Cold Climates
From BloombergBusiness, "Electric Cars Can’t Take the Cold: Batteries generate power less efficiently as temperatures drop." by Jeff Plungis:
The batteries used by the greener cars generate electricity from chemical reactions that work less efficiently as temperatures drop. In tests conducted by the American Automobile Association, an electric car that ran for 105 miles at 75F went only 43 miles at 20F—a 60 percent reduction in range.
That’s causing anxiety in places such as Maine, a mostly rural state where people drive long distances for work, shopping, and recreation. "People said don’t worry about it," says Tom Brown, president of the Maine Automobile Dealers Association of the battery range problem. But, he says, "California is not Maine. They’ve got more people in five city blocks than we do in the whole state."*** The bottom line: Nine states have adopted California’s targets for electric car sales, even though the batteries don’t work well in the cold.
Wednesday, December 2, 2015
Median Rent Increases Outpacing Median Household Income Growth
From The Wall Street Journal, "Some Families Earn Six Figures and Still Need Help With the Rent: Cities beyond New York and San Francisco move to set aside apartments for middle-income households; Cambridge, Mass., with $2,750 median rents, holds housing lottery" by Laura Kusisto and Jon Kamp:
Source: The Wall Street Journal

Friday, November 27, 2015
Huge Increase In Opioid Addiction Among Seniors
From the National Institutes of Health, MedlinePlus, "Those in Their 50s Now Largest Group Battling Addiction to Narcotics: Study: Big jump also seen in those aged 60 and older needing treatment for painkiller, heroin abuse" by Robert Preidt:
Older adults are now the largest age group seeking help in narcotic painkiller and heroin treatment programs, a study based in New York City found.*** People aged 50 to 59 accounted for about 8 percent of narcotic painkiller and heroin treatment patients in 1996, but they represented nearly 36 percent in 2012. The proportion of patients aged 60 to 69 also rose dramatically, from 1.5 percent to 12 percent, the study revealed.
"These increases are especially striking, considering there was about a 7.6 percent decrease in the total patient population over that period of time, and suggests that we are facing a never before seen epidemic of older adults with substance use disorders and increasing numbers of older adults in substance abuse treatment," Han said.
The proportion of such patients aged 40 and younger fell from about 56 percent in 1996 to about 20 percent in 2012, the study showed.
Friday, November 20, 2015
Uncertainty Forecast Ranges Of CBO's Long-Term Budget Projections
From Congressional Budget Office, "The Uncertainty of Long-Term Budget Projections" Presentation by Ben Page:
CBO’s long-term budget projections generally reflect current law and estimates of future economic conditions and demographic trends. Those projections depend on estimates of the future paths of mortality rates, productivity, interest rates, and health care costs, among many other variables. To illustrate some of the uncertainty about long-term budgetary outcomes, CBO constructed alternative projections showing what would happen to the budget if those factors differed from the values used in the extended baseline.
Thursday, November 19, 2015
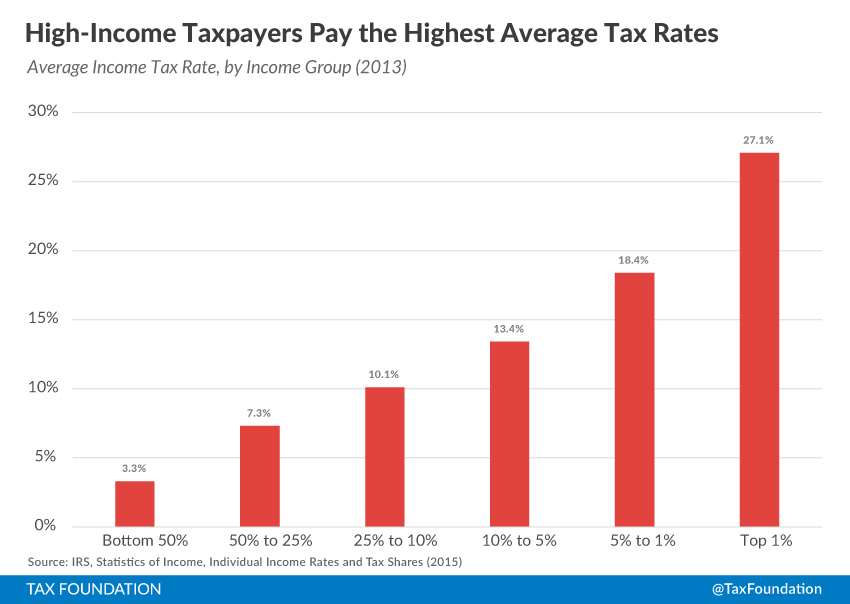
High-Income Americans Pay The Majority of Federal Taxes And Pay The Highest Average Tax Rates
From Tax Foundation, "Summary of the Latest Federal Income Tax Data, 2015 Update" by Scott Greenberg:
High-Income Americans Paid the Majority of Federal Taxes
In 2013, the bottom 50 percent of taxpayers (those with AGIs below $36,841) earned 11.49 percent of total AGI. This group of taxpayers paid approximately $34 billion in taxes, or 2.78 percent of all income taxes in 2013.
In contrast, the top 1 percent of all taxpayers (taxpayers with AGIs of $428,713 and above), earned 19.04 percent of all AGI in 2013, but paid 37.80 percent of all federal income taxes.
In 2013, the top 1 percent of taxpayers accounted for more income taxes paid than the bottom 90 percent combined. The top 1 percent of taxpayers paid $465 billion, or 37.80 percent of all income taxes, while the bottom 90 percent paid $372 billion, or 30.20 percent of all income taxes.
Chart 1.
 |
| Source: Tax Foundation |
*** Chart 2.
 |
| Source: Tax Foundation |
Wednesday, November 18, 2015
US Annual Solar Photovoltaic (Solar Panel) Installations In Megawatts
From The Wall Street Journal, Journal Reports: Energy, "Will Solar Energy Plummet if the Investment Tax Credit Fades Away? Many solar supporters say the loss or reduction of the credit will be a ‘cliff’ for the industry. But others say the credit’s impact is overstated and solar will continue to grow:"
Source: The Wall Street Journal

Tuesday, November 17, 2015
States With The Worst And Best Business Tax Climates
From Tax Foundation, "2016 State Business Tax Climate Index" by Jared Walczak, Scott Drenkard, Joseph Henchman:
The Index is designed to show how well states structure their tax systems, and provides a roadmap for improvement.
The 10 best states in this year’s Index are:1. Wyoming
2. South Dakota
3. Alaska
4. Florida
5. Nevada
6. Montana
7. New Hampshire
8. Indiana
9. Utah
10. Texas*** The 10 lowest ranked, or worst, states in this year’s Index are:
41. Maryland
42. Ohio
43. Wisconsin
44. Connecticut
45. Rhode Island
46. Vermont
47. Minnesota
48. California
49. New York
50. New Jersey
Lower Percentage Of College Students Are Graduating
From The Wall Street Journal, "College Graduation Rate Shrinks, Study Finds: Research shows just 52.9% of students who began four-year programs in fall 2009 had graduated" by Melissa Korn:
Just 52.9% of students who began four-year programs in fall 2009 had graduated from such institutions within six years, according to a report released Tuesday by the National Student Clearinghouse Research Center, compared with 55% for the class that started in 2008 and 56.1% the year before that.*** But students of all ages, and at all types of institutions, completed school at a lower rate than those who started down the college path the prior year.*** Though a smaller percentage of students made it to the finish line this year, the total number of graduates increased by about 71,000 for the latest class, since more students—2.9 million—entered college in 2009 than in the prior year.
Monday, November 16, 2015
US Government Guaranteed 75 Percent Of New Mortgages For Home Purchases In 2015: Up From 30 Percent In 2006
From The Washington Post, Opinion, "Why Fannie Mae and Freddie Mac survived" by Robert J. Samuelson:
Here are the numbers. Fannie and Freddie provide government mortgage guarantees (i.e., if homeowners default, the GSEs repay mortgage investors in full). In 2015, GSE guarantees cover about half of new mortgages for home purchases; including other agencies — the Federal Housing Administration, which caters to lower-income borrowers, and Veterans Affairs — the government guarantees three-quarters of new mortgages. By contrast, the government’s share in 2006 was slightly more than 30 percent, with the GSEs representing most of that.
We have effectively nationalized housing finance. Private money retreated, and the GSEs have returned to profitability — with all the profits going to the U.S. treasury.
Wednesday, November 11, 2015
CBO Overestimates Total Revenue By 1.1 Percent On Average With A Mean Absolute Error Of 5.2 Percent
From The Congressional Budget Office, November 10, 2015 Report, "CBO’s Revenue Forecasting Record:"
How Accurate Have CBO's Two-Year Revenue Projections Been?
On average, CBO has overestimated total revenues by 1.1 percent in its two-year projections—those that provide estimates of revenues for the fiscal year following the year in which they are released. A misestimate of that size in its January 2015 baseline projection, for example, would amount to $37 billion out of the roughly $3.5 trillion in total revenues that CBO projected for fiscal year 2016. Overestimates and underestimates offset one another in the mean error measure, so that average overestimate of 1.1 percent over the past three decades includes projections for years in the latest recession for which CBO overestimated revenues by as much as 25 percent and projections for the late 1990s and the mid-2000s for which CBO underestimated revenues by nearly 10 percent (see the figure below). The calculation of those errors—and of all such measures cited in this report—includes an adjustment to remove the estimated effects of legislation enacted after the projections were produced. That adjustment is necessary because the baseline projections incorporate the assumption that current laws governing taxes will generally not be modified by future legislation.
Source: CBO *** In addition to the mean error, CBO employs two other commonly used measures to evaluate the accuracy of revenue projections: the root mean square error (RMSE) and the mean absolute error. Unlike the mean error, the mean absolute error is the average of the errors without regard to direction (the negative signs are removed from underestimates before averaging), so errors in different directions do not offset one another. The RMSE, the calculation of which involves squaring the errors (thus removing the negative signs), also measures the size of errors without regard to direction, but by squaring the errors, it places a greater weight on larger deviations. The mean absolute error is an easier measure to understand, but the RMSE may be a more useful measure of forecast errors for revenue projections because larger forecast errors may have a disproportionately greater cost for policymaking than smaller ones.
For CBO's two-year revenue projections made since 1982, the mean absolute error is 5.2 percent, and the RMSE is 7.4 percent (see the table below). A mean absolute error of that magnitude would correspond to an error of about $180 billion in the revenue estimate for 2016 that CBO released in its January 2015 baseline projections. Because a disproportionate share of the misestimates occurred in projections made in years immediately preceding recessions, both the RMSE and the mean absolute error are roughly one-third smaller when the four two-year projections (out of the 32 included in this analysis) that were produced at or near peaks in the business cycle are excluded.
Source: CBO
*** How Efficiently Has CBO Incorporated New Information?
CBO has tended to revise consecutive revenue forecasts in the same direction, suggesting that the agency does not efficiently incorporate new information into its forecasts. That tendency was less pronounced in the past 15 years than it was in the previous period, although the limited number of forecasts that can be assessed makes it difficult to conclude that CBO has improved its use of new information. That tendency, furthermore, has varied significantly over the entire history of CBO's forecasts, and CBO's forecast accuracy would not have been systematically improved had the agency incorporated into its forecasts what was known at the time about that tendency; such modifications would have over adjusted the forecasts in many cases.


Tuesday, November 10, 2015
Low Calorie Sweeteners Help Reduce Body Weight
From "Low energy sweeteners help reduce energy intake and body weight" in ScienceBlog:
Use of low energy sweeteners (LES) in place of sugar, in children and adults, leads to reduced calorie intake and body weight – and possibly also when comparing LES beverages to water – according to a review led by researchers at the University of Bristol published in the International Journal of Obesity today.Study published in "Does low-energy sweetener consumption affect energy intake and body weight? A systematic review, including meta-analyses, of the evidence from human and animal studies" by Rogers et al in the International Journal of Obesity.
For the first time, all available science was integrated into a single review to evaluate the real impact of LES, such as saccharin, aspartame, sucralose and stevia, on energy intake (EI) and body weight (BW) over the short- and long-term. A considerable weight of evidence confirmed that consuming LES instead of sugar helps reduce relative energy intake and body weight.*** The authors conducted systematic reviews of relevant studies in animals and humans consuming LES in a non-restricted diet. In total, 12 human prospective cohort studies, 228 comparisons in human intervention studies (short and long-term) and 90 animal studies were examined.
Monday, November 9, 2015
S&P 500 Vs Hedge Fund Returns Since 2001 Chart
From BloombergView, "The Reason Pension Plans Stick With Hedge Funds" by Barry Ritholtz:
Source: BloombergView

Wage Inequality Growth Caused By Some Firms Paying Higher Salaries To All Workers And Not Selective Pay Growth Within Firms or CEO Salaries
From The Wall Street Journal, Real Time Economics, "What’s Driving Inequality: CEO Pay or Company Success?" by Greg Ip:
Prior to this research, it was known that larger forms tend to pay more for the same job than smaller firms and that some industries pay more for a job function than others. For example, hospitals pay janitors a higher salary than other companies; technology firms pay more for computer programmers than industrial companies, etc. What the study mentioned above shows is that the growth in wage inequality is due to the differences in growth in pay across firms and industries and not due to selective pay growth within firms.
A National Bureau of Economic Research paper caused a stir earlier this year by claiming all of the rise in inequality since 1980 was between firms, not within firms, implying executive pay played no role.From The Wall Street Journal, "Behind Rising Inequality: More Unequal Companies: More competition would help narrow the gap between the highest- and lowest-paid employees" by Greg Ip:
The paper [Firming Up Inequality], by Jae Song of the Social Security Administration, David J. Price and Nicholas Bloom of Stanford University, Fatih Guvenen of the University of Minnesota and Till von Wachter of the University of California, Los Angeles, looked at a large sample of more than 100 million employees and linked their pay to the average pay within their own firm.
They found that while incomes of the highest-paid workers (e.g., those earning more than 90% or 99% of all others) had indeed grown faster than the median, they had not grown faster than those of their co-workers. For example, the employee at the 90th percentile earned 1.69 times as much as his firm’s average wage in 1980, and 1.73 times as much in 2013. An employee at the 99th percentile earned 3.57 times his firm’s average in 1980, and 3.48 times in 2013.
From this they concluded that "virtually all of the rising dispersion between workers" was caused by the dispersion between firms, contradicting Thomas Piketty, author of "Capital in the Twenty-First Century," and others who say it’s due to the top 1% pulling away.
Mounting evidence suggests the prime driver of wage inequality is the growing gap between the most- and least-profitable companies, not the gap between the highest- and lowest-paid workers within each company. That suggests policies that have focused on individuals, from minimum wages to education, may not be enough to close the pay gap; promoting competition between companies such as through antitrust oversight may also be important.
*** Separate research suggests that pay has closely followed these companies’ fortunes. Jae Song of the Social Security Administration and four co-authors [Firming Up Inequality] looked at pay records of more than 100 million workers between 1980 and 2013, and compared their pay to that of other workers at the same firm. Workers at the 90th and 99th percentile did see their pay rise much more than median and lower-paid workers over the period. But no such disparity appeared among co-workers at the same firm: the ratio of their pay to their firm’s average remained flat. In other words, everyone at the top companies, from the lowest to highest paid, pulled away from the pack, and everyone at the bottom companies languished.
Source: The Wall Street Journal

Prior to this research, it was known that larger forms tend to pay more for the same job than smaller firms and that some industries pay more for a job function than others. For example, hospitals pay janitors a higher salary than other companies; technology firms pay more for computer programmers than industrial companies, etc. What the study mentioned above shows is that the growth in wage inequality is due to the differences in growth in pay across firms and industries and not due to selective pay growth within firms.
Industries With Most Lobbyists
From The Wall Street Journal, "Colleges Flex Lobbying Muscle: With campuses, jobs in every district, schools push Congress to sink new rules" by Brody Mullins, Douglas Belkin and Andrea Fuller:
Source: The Wall Street Journal

Saturday, November 7, 2015
Like A Movie Actor Whose Onscreen Decisions Do Not Impact The Real Lives Of The Movie Going Audience, Obama's Keystone Pipeline Rejection Does Not Affect Canadian Oil Imports Into The US Or Decrease Carbon Output
From The Washington Post, "Obama rejects Keystone XL project, citing U.S. climate leadership" by Juliet Eilperin and Steven Mufson:
Rail transport has expanded to carry oil sands to the United States, soaring from just 16,000 barrels in 2010 to 51.2 million barrels in 2014 before dropping somewhat this year. But rail transport is more expensive than pipeline transport. And the extra cost looms larger in light of current oil prices, which are about half what they were for much of the past six years.From The New York Times, "Citing Climate Change, Obama Rejects Construction of Keystone XL Oil Pipeline" by Coral Davenport:
Yet the final rejection of the Keystone XL project was widely expected in the oil industry, and many companies have already made other plans. U.S. imports of oil from Canada hit a record high of 3.4 million barrels a day in August, up from just under 2 million barrels a day in 2008, the year the pipeline was proposed. That has happened even as U.S. domestic oil production has risen by more than half and despite delays in Keystone XL. [Emphasis added.]
But numerous State Department reviews concluded that construction of the pipeline would have little impact on whether that type of oil was burned, because it was already being extracted and moving to market via rail and existing pipelines. [Emphasis added.]
Friday, November 6, 2015
Junk Food And Soda Are Not Causing Obesity Epidemic
From MarketWatch, "Soda and junk foods are not making you fat" by Quentin Fottrell:
Soda, candy and fast-food are often blamed for the rising rates of obesity in America and, while eating any one high-calorie or high-sugar food to excess is obviously unhealthy, a major new study found that consumption of these foods is not related to Body Mass Index in 95% of the population. The report was published by the Food & Brand Lab at Cornell University in Ithaca, N.Y. "While a diet of chocolate bars and cheese burgers washed down with a Coke is inadvisable from a nutritional standpoint, these foods are not likely to be a leading cause of obesity," the study said.
Underweight Americans actually consumed more soda and sweet snacks than average-weight individuals, while overweight, obese, severely obese and morbidly obese individuals consumed less soda, sweet snacks and salty snacks than average-weight individuals. Morbidly obese people (with a BMI of 44.9 or more) ate fewer sweet snacks and salty snacks. Oddly, they did eat 50% more French fries than average-weight individuals. The researchers say people shouldn’t deprive themselves of their favorite food because that sacrifice is unlikely to be related to their weight – unless, that is, their favorite food is French fries.
So what’s the culprit? Calories in, calories out. The amount you eat versus the amount of exercise you get. Americans are eating over 500 calories more every day than they did four decades ago: 2,544 calories per day in 2010 versus 2,039 in 1970. And there are some other culprits -- aside from French fries -- but they exist across a range of meals. The number of calories consumed every day spiked for grains such as white bread (409 calories in 1970 versus 582 calories in 2010), added oil and dairy fats (346 versus 589 calories) and added sugars (333 versus 367 calories).
Source: MarketWatch ***
The study, which was published in the October edition of the journal Obesity Science & Practice, analyzed the consumption of these foods by nearly 6,000 people from the Centers for Disease Control’s “National Household and Nutrition Examination Survey,” and cross-referenced this data to their body mass index, used as a measure of obesity.

Monday, November 2, 2015
Moving A US Company Overseas Makes It Easier To Invest In US Due To Lower US Tax Burden
From The Wall Street Journal, Opinion, Review & Outlook,"The Corporate Tax Political Divide: Democrats are driving U.S. companies and capital offshore:" by
And yes, moving the business overseas would ironically make it easier to invest in the United States, thanks to the insane tax burden the Treasury now applies when U.S. firms want to bring profits back from overseas and invest them at home.
Mr. [Ian] Read [Pfizer Chairman and CEO] was speaking in general terms and not discussing the particulars of the potential merger his firm is now discussing with Allergan, but he neatly explained the competitiveness problem faced by U.S. companies. He noted that after paying Irish corporate income taxes, a firm based there still retains roughly 88 cents on each dollar of profits, which it can choose to invest in the U.S.
But if a U.S. company makes the same dollar in Ireland and pays the same local tax to Irish authorities, its 88-cent after-tax profit gets whittled down to 65 cents if the money is invested in the U.S. That’s because the U.S. is one of a small handful of tax collectors worldwide that demands to be paid even after a domestic company has already paid the overseas territory where it made the money.
Saturday, October 31, 2015
New NASA Study Says Antarctic Ice Is Increasing Not Decreasing: Antarctica Is Adding Enough Ice To Outweigh Losses
From "NASA study: Mass gains of Antarctic Ice Sheet greater than losses" on ScienceBlog:
A new NASA study says that an increase in Antarctic snow accumulation that began 10,000 years ago is currently adding enough ice to the continent to outweigh the increased losses from its thinning glaciers.
The research challenges the conclusions of other studies, including the Intergovernmental Panel on Climate Change’s (IPCC) 2013 report, which says that Antarctica is overall losing land ice.
According to the new analysis of satellite data, the Antarctic ice sheet showed a net gain of 112 billion tons of ice a year from 1992 to 2001. That net gain slowed to 82 billion tons of ice per year between 2003 and 2008.
Friday, October 30, 2015
A Beneficent Top 1 Percent: Just 1.4 Percent Of Federal Estate Tax Filers Leave $10.6 Billion To Charity, 58 Percent Of Charitable Bequests
From The Wall Street Journal, Real Time Economics, "When the Superrich Die, Here’s What’s in Their Wallets" by Richard Rubin and Josh Zumbrun:
The richest people pass on smaller shares of their estates to their heirs–and it’s not just because of more of their wealth is subject to taxation. They tend to have bigger debts and make bigger charitable contributions. Charities collected $18.4 billion from bequests from the returns filed in 2014, with 58 percent of that coming from just 1.4 percent of estate tax returns.
 |
| Source: The Wall Street Journal |
Wednesday, October 28, 2015
About Two-Thirds Of 4th and 8th Grade Public School Students Cannot Read: How Can Anyone Continue To Support Public Schools And Teacher Unions
From The Washington Post, "U.S. student performance slips on national test" by Emma Brown:
The 2015 scores [on the National Assessment of Educational Progress (NAEP) tests] show that 64 percent of fourth-graders and 66 percent of eighth-graders are not considered proficient in reading. In math, 60 percent of fourth-graders and 67 percent of eighth-graders are not considered proficient.
Tuesday, October 27, 2015
Fed's Low Interest Rate Policy Decreased The Value Of Investing In Risky Growth Opportunities
My comment to The Wall Street Journal, Opinion, Commentary, "The Fed Has Hurt Business Investment: QE is partly to blame for record share buybacks and meager capital spending." by Michael Spence and Kevin Warsh:
Investors know that the most valuable and the most risky business opportunities are those with growth potential. Growth potential creates competition and uncertainty with the potential for huge rewards to investors and the economy.Also, see my April 23, 2015, blog post, "Disinvestment: Declining US Business Domestic Investment In Excess Of Depreciation."
Low interest rates increase the value of existing and mature investments with limited growth potential. Low interest rates can turn a new opportunity's negative net present value (time valued payback) to positive and increase investment in marginal business opportunities without growth potential.
Real (call) Options are a good way place a value on the uncertain future growth potential of capital investments. Low interest rates decrease the value of call options. A lower value for Real Options and growth decreases investment in growth opportunities.
Net (w/o existing capital replacement) Business Investment is low. The Fed's low interest rates decreased the value of investing in risky growth business opportunities and stunted the growth of the US economy.
Friday, October 23, 2015
Less Than 10 Percent Of US Adults Use Marijuana In A Past Year
From The National Institute of Health, "Prevalence of Marijuana Use Among U.S. Adults Doubles Over Past Decade: Surveys show 9.5 percent of Americans use marijuana; 30 percent of users meet criteria for a disorder:"
The percentage of Americans who reported using marijuana in the past year more than doubled between 2001-2002 and 2012-2013, and the increase in marijuana use disorder during that time was nearly as large. Past year marijuana use rose from 4.1 percent to 9.5 percent of the U.S. adult population, while the prevalence of marijuana use disorder rose from 1.5 percent to 2.9 percent, according to national surveys conducted by the National Institute on Alcohol Abuse and Alcoholism (NIAAA), part of the National Institutes of Health.*** The marked increase in marijuana use and marijuana use disorder shown in the study is a significant change from prior results. Earlier NIAAA research found that marijuana use remained stable at about 4 percent of the U.S. population between 1991-1992 and 2001-2002, while abuse and dependence rose from 1.2 percent to 1.5 percent.
Friday, October 16, 2015
What Socialists and High Tax Progressives Forget About Capitalism
Capitalism is nothing more than private ownership with a profit motive. Economic profits exist only after all costs are paid. Material, labor, and equipment costs, plus debt cost (interest and principal) and a fair return on invested monies must be paid regularly or a company will cease to exist. If there are no profits, then there is insufficient money to pay back completely the costs of material, labor, equipment, and debt and equity investment. Without profits, workers do not get fully paid; material and equipment suppliers do not get fully paid; lenders and investors do not get paid.
A company that cannot regularly pay back its costs will cease to exist. Workers will not work for free or partial wages. Suppliers will not supply it. Lenders will not lend to it and investors will not invest in it.
Capitalism enables business to be self-sustaining. It enables a company to pay back all its ongoing costs. Capitalism is a sustainable economic system. The companies that are not self-sustaining are removed and replaced with sustainable companies.
Not-for-profits and governments are not financially self-sustaining. They are not economically sustainable systems. Left on their own, they would cease to have funds and government printed money would be worthless. They always are in need of more outside funding. Not-for-profits are always planning fund raising campaigns to pay off expenses they have already incurred or will incur in the coming year. Governments are always looking for ways to increase fees and taxes and to rollover debt to pay for government employee salaries, government programs and the military. Governments and not-for-profits are dependent on a vibrant capitalistic system to create wealth and companies with profits. Without a dynamic fully functioning capitalistic system, governments will quickly run out of funds to tax and redistribute.
Not-for-profits and governments need a replenishable source of funds. Capitalism is the only economic system that can regularly generate a sustainable source of profit and wealth.
Taxes and income and wealth redistributions do not create income, profits or wealth.
Government interference through laws, regulation and taxes creates structural rigidities and additional expenses for businesses. In general, government reduces businesses ability to generate wealth and profits and adapt to changing business environments.
A government that increases business costs through restrictive laws and regulations and harshly taxes business and wealth will find itself unable to accomplish for its populace the very things it thought its laws, regulations and taxes would allow it to do. It will diminish its very source of sustainability. It will find that its source of funding is no longer as reliable and plentiful as it once was. It will find it cannot do what it set out to do through law, regulation and tax.
Monday, October 12, 2015
Prisoners Against Minimum Wage For Prison Work
From The Wall Street Journal, Opinion Commentary, "My Prison Job Wasn’t About the Money: Protesting low pay will drive out companies and deprive inmates of valuable, life-affirming experience." by Chandra Bozelko:
The clamor over low inmate pay neglects one essential fact, one that is central to the current preoccupation with justice reform: Inmate work programs are the best known way to rehabilitate prisoners. Honest work elevates people regardless of what they are paid. Work humanizes inmates; employed inmates seem less like caged animals. While they paid me less than two dollars a day, my supervisors valued me as a person and an employee, at a time when no one else did, including myself.
This is why, even with the low wages, inmates who work in a prison are statistically more likely to find jobs quickly upon release and keep those jobs longer—which, in turn, lowers recidivism rates. According to a March study by the Manhattan Institute, "rapid attachment" to employment reduces recidivism by released offenders by another 20%. Getting and keeping a job requires more than just vocational training; an ex-offender needs to get along in the workplace, too, and that’s what prison work assignments teach.*** But those calling for a minimum wage for inmates who work are ignoring the likely consequences. A minimum wage for inmates would stop jobs for inmates. If governments and private companies were forced to pay inmates more, prison jobs would be outsourced to the free world because they can observe and supervise minimum-wage employees there but they can’t see a “justice-involved” worker behind bars. It is the low wages that induce companies to establish so called “factories behind fences” and create prison jobs where they didn’t already exist.
Tuesday, October 6, 2015
Only 28 Percent Of The Unemployed Receive Government Benefit Payments: Down From 67 Percent In 2010
From The Wall Street Journal, Real Time Economics, "Less Than a Third of Unemployed Americans Get Benefit Checks" by Eric Morath:
Source: The Wall Street Journal
Those receiving government payments last month represented less than 28% of all unemployed Americans, according to an analysis of Labor Department data. That figure is down from 31% a year earlier. And it’s well below the 67% who received the assistance in September 2010, when emergency federal programs extended benefits beyond the 26 weeks granted in most states, to as long as 99 weeks.*** When benefits expire, unemployed workers frequently face two likely outcomes: They accept lower-paying work or they drop out of the labor force. Both choices were common among those who lost benefits in North Carolina in 2013.
Those who drop out might have found that it makes financial sense to retire, return to school, stay at home to care for children or older adults, or seek out other forms of government assistance. Each of those choices could remove a person from the labor force. The labor-force participation rate has been trending at the lowest levels since the 1970s.

Monday, October 5, 2015
World Poverty At Record Low
From BloombergBusiness, "Extreme Poverty in the World Is About to Hit a Record Low: We're one step closer to eradicating extreme poverty by 2030" by Andrew Mayeda:
Source: BloombergBusiness
Almost half of the world’s extreme poor live in sub-Saharan Africa, according to the 2015 projection. That's up from about 15 percent in 1990. By contrast, there have been dramatic declines in poverty in East and South Asia over the same period as China and India emerged as economic powers.
“In the areas where there are large numbers of people living in extreme poverty, extreme poverty has deepened and become more embedded,” said Kim.
In addition to the new projection, the World Bank raised its definition of extreme poverty to income of $1.90 per day, from $1.25. The new poverty line adjusts for inflation using 2011 prices that account for purchasing power as a baseline.

Saturday, October 3, 2015
Past Banking Runs, Crises And Failures Were Not Stopped By Stricter Mortgage Lending And Higher Bank Equity
My comment posted to The Wall Street Journal, Opinion Commentary, "How Not to Prevent the Next Financial Meltdown: Dodd-Frank’s safeguards against chaos are based on a misdiagnosis of what led to the 2008 crisis." by Edward P Lazear:
100 years ago national banks and some state banks were prevented from making mortgage loans. Banks that could make mortgages required a buyer to put 50 percent down and to payoff the mortgage in 3-5 years. Bank crises occurred anyway.
The older, more stringent lending requirements did not stop bank runs, bank failures, or, in the 1930s, mortgage defaults and foreclosures. Tough mortgage lending decreases the availability of mortgages and limits home purchases.
Increasing the number of loans requires increasing available bank funding through equity or debt.
Many publicly traded banks regularly trade below book value, which means a bank cannot earn enough in its business to attract and compensate equity owners for the risk, and limits its ability to issue equity. To increase the equity ratio, banks usually shrink loan assets. More debt is easier.
Without FDIC, TBTF [Too Big To Fail], GSEs [GNMA, FNMA, etc.], or securitization, many in the middle class would not get mortgages because banks could not get funding for home loans.
Thursday, October 1, 2015
Women Make Different Work Choices Than Men: My Comment To Wall Street Journal Wage Gap Myth Commentary
My comment to The Wall Street Journal Opinion Commentary, "The ‘Wage Gap’ Myth That Won’t Die: You have to ignore many variables to think women are paid less than men. California is happy to try." by Sarah Ketterer:
For years, federal and state laws have prohibited gender wage discrimination within a company. These wage laws are enforceable by the government and private lawsuits. Despite claims that a substantial number of women in the workforce are paid about 20 percent less than men, there are few, if any, private or government wage discrimination legal actions and most find the company did not discriminate. Why aren't women suing in huge numbers and why do the few who sue lose, if the discrimination is real?
Within most companies, there is no gender wage discrimination. The statistic only appears when one compares wages across different companies and industries. The gap statistic cited excludes the value of benefits, workers' experience and work environments. Companies are different. Higher paid work with higher work injury rates, frequent unscheduled overtime, overnight travel, fewer days off and lower benefit value attract fewer women than men.
Women choose work differently than men.
Wednesday, September 23, 2015
Number Of Work Hours Needed To Buy An IPhone 6 In Different Cities Internationally
From The Wall Street Journal, Real Time Economics. "The Most Expensive Place in the World to Live" by Nick Timiraos:
Source: The Wall Street Journal, Real Time Economics
New Yorkers, for example, need to work around 24 hours to make enough money to buy an iPhone 6. That’s up from 20.6 hours for residents of Geneva, but much lower than 163.8 hours for residents of Shanghai or 334.2 hours for residents of Manila.

Tuesday, September 22, 2015
Non-Bank Lenders Take Biggest Share Of Mortgages Since 1995
From The Wall Street Journal, "Number of New Mortgages in 2014 Plunges 31% From Year Before: Nonbank lenders accounted for biggest share of lending since at least 1995" by Joe Light:
Nonbank lenders in 2014 took their biggest share of the mortgage market since at least 1995, new data show, as several large banks pulled back on lending to all but the most pristine borrowers.
According to federal government data released Tuesday, nondepository independent mortgage companies in 2014 accounted for 47% of loans to buy homes for owner-occupants and 42% of refinancing loans. Those market shares increased from 43% and 31%, respectively, in 2013.
The home-purchase share last year was 12 percentage points higher than in 2010.
Saturday, September 19, 2015
Map Of Areas Of US That Most Benefit From Deduction For State And Local Taxes
From Tax Foundation, "The Biggest Loser of the Presidential Campaign So Far: the State and Local Tax Deduction" by Alan Cole:
[T]he deductibility of state and local taxes (including property taxes) is expected to result in $81 billion of lost revenue for the federal government in 2015, according to the latest OMB estimates. For another, the policy only benefits particular kinds of taxpayers. For example, it benefits those who itemize their deductions, rather than opting for the standard deduction. This is often characterized as regressive, because itemizers tend to be much wealthier than those who take the standard deduction. Furthermore, its value often varies heavily from place to place. This can be seen on a map we recently published of the values of state and local deductions taken per return.
Source: Tax Foundation
This policy is a kind of ad-hoc, incomplete, and arbitrary subsidy for state and local tax revenues. It benefits federal taxpayers extremely unequally, and it costs a lot of money that could be used for lower rates.

Wednesday, September 16, 2015
Low Income And Wealthier Children Eat About The Same Percentage of Fast Food Calories: Casting Doubt That Fast Food Causes Obesity In The Poor
From BloombergBusiness, "Rich Kids Eat a Ton of Fast Food Too: Income doesn't matter." by John Tozzi:
Kids from low-income families are more likely to be obese than wealthier children, research suggests. But the relationship is complex, and scientists are still trying to untangle the links between income and such factors as diet and exercise that contribute to obesity.
New data make those connections even more complicated. Low-income kids—from households earning less than $31,500 for a family of four—got about the same percentage of their calories from fast food as wealthier kids, according to a federal survey of more than 5,000 people, including children of all ages, from the Centers for Disease Control (CDC).
***
Source: BloombergBusiness
Other recent research has questioned the notion of food deserts' role in diet and weight. In Los Angeles, for example, little evidence supports the idea that living near junk food outlets increases obesity rates, according to another recent CDC study.

Friday, September 11, 2015
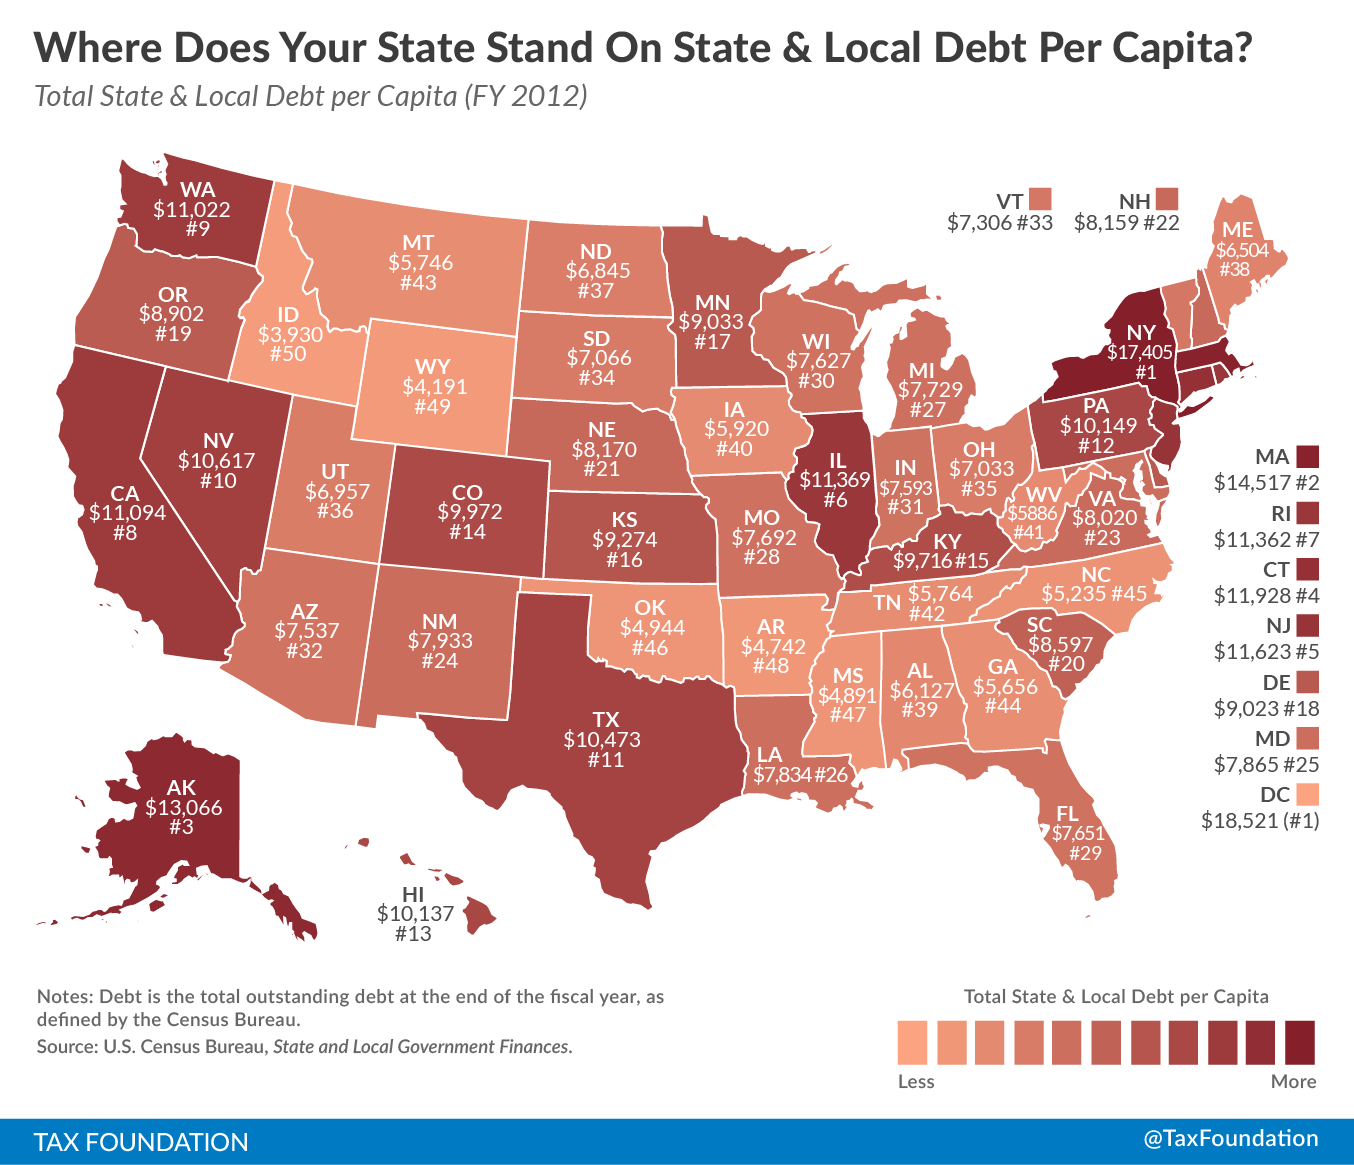
NY Has The Highest State And Local Debt Per Person; Followed By Massachusetts
From Tax Foundation, "Where Does Your State Stand on State & Local Debt Per Capita?" by Jared Walczak and Liz Malm:
 |
| Source: Tax Foundation |
States with the highest amount of state and local debt per capita in the 2012 fiscal year (the most recent data available from the Census Bureau) were New York ($17,405 per person), Massachusetts ($14,517 per person), Alaska ($13,066 per person), Connecticut ($11, 928 per person), and New Jersey ($11,623 per person).
On the other end of the spectrum, states with the lowest state and local debt per capita were Idaho ($3,930 per person), Wyoming ($4,191 per person), Arkansas ($4,742 per person), Mississippi ($4,891 per person), and Oklahoma ($4,944 per person).
Chart Of Number Of US Children Born To Illegal Immigrants: 1992-2013
From The Wall Street Journal, "Fact-Checking the Figures on ‘Anchor Babies’: Note to presidential candidates: Estimate of some 400,000 such births is outdated" by Jo Craven McGinty:
Still, the numbers disturb Mr. Trump and others who favor cracking down on illegal immigration because as citizens, these children automatically get access to education, health care and other services. At age 21, they can also apply for legal status for their undocumented parents and siblings, which is why critics refer to them as anchors.
For those and other reasons, different groups have tried to pin down their number. The Migration Policy Institute, the Center for Migration Studies and the Pew Research Center, in addition to the Center for Immigration Studies, have all published estimates.
The figures peaked in 2007-10. In that span, the Migration Policy Institute put the high number at 321,000; the Center for Migration Study pegged it at just under 350,000; and the Pew Research Center put it at 370,000.
The numbers vary because each group uses a slightly different approach.***
Source: The Wall Street Journal

Unionized Workers Significantly Less Satisfied Than Non-Union Employees With Job Security, Workplace Safety, Supervisor, Recognition, Hours Flexibility
From Gallup, "Union Members Less Content With Safety, Recognition at Work" by Andrew Dugan:
In the U.S., employed Americans who report being members of labor unions are significantly less likely than nonunion employees to say they are "completely satisfied" with six of 13 job aspects. These include workplace safety, recognition for accomplishments, flexibility of hours and job security. In only one job aspect, employer-provided health insurance, are union workers significantly more likely than nonunion workers to say they are completely satisfied.
Wednesday, September 9, 2015
New Start-Up Businesses Are A Declining Share Of US Companies And US Employment Over The Past 35 Years
From The Wall Street Journal, "Starting a Business is Easy (for Harvard Business Grads)" by Jeffrey Sparshott:
But separate Commerce Department data show startups–firms less than a year old–make up a significantly smaller share of all companies and employment than during 1980s or 1990s. The authors worry that may be limiting one historical path to the middle class.
Source: The Wall Street Journal
Source: The Wall Street Journal


Thursday, September 3, 2015
Making The Case That Humanities Majors Make Better Programmers
From the Atlantic, "You Don't Have to Be Good at Math to Learn to Code: Learning to program involves a lot of Googling, logic, and trial-and-error—but almost nothing beyond fourth-grade arithmetic." by Olga Khazan:
In order to figure out what your program should say, you’re going to need some basic logic skills. You’ll also need to be skilled at copying and pasting things from online repositories and tweaking them slightly. But humanities majors, fresh off writing reams of term papers, are probably more talented at that than math majors are.
I know plenty of people with bachelor’s, master’s, and even doctorate degrees in philosophy or international relations who have taught themselves to code. It’s true that some types of code look a little like equations. But you don’t really have to solve them, just know where they go and what they do. The programmer and entrepreneur Emma Mulqueeny puts it well:
In most cases you can see that the hard maths (the physical and geometry) is either done by a computer or has been done by someone else. While the calculations do happen and are essential to the successful running of the program, the programmer does not need to know how they are done.
Wednesday, September 2, 2015
Highest US Entrepreneurship Rate In At Least 16 Years
From MarketWatch, "Entrepreneurship study finds highest recorded levels" by Caitlin Huston:
Entrepreneurship in the United States is at its highest rate in at least 16 years, a new study reports.
According to a study released Wednesday by Babson College and Baruch College, 14% of the United States working age population, about 24 million people, reported being entrepreneurs in 2014. But they weren’t all like Mark Zuckerberg starting Facebook in a Harvard dorm — 6.5% were forming businesses within established companies and 11% were between the ages of 55 and 64, the highest rate of entrepreneurship activity for that age group among 29 developed economies in the study.
The results were the strongest since the colleges began the study in 1999. The study surveys a representative sample of the U.S. population to extrapolate the results and defines entrepreneurship as businesses less than 3.5 years old.
Tuesday, September 1, 2015
Highest Student Loan Default Rates For Borrowers With Lowest Debt Amounts
From The New York Times, The Upshot, "Why Students With Smallest Debts Have the Larger Problem" by Susan Dynarski:
*** Defaults are concentrated among the millions of students who drop out without a degree, and they tend to have smaller debts. That is where the serious problem with student debt is. Students who attended a two- or four-year college without earning a degree are struggling to find well-paying work to pay off the debt they accumulated.***
Source: The New York Times
Most borrowers have small debts, according to the Federal Reserve Bank of New York; 43 percent borrowed less than $10,000, and 72 percent less than $25,000. And borrowers with the smallest debts are most likely to default. Of those borrowing under $5,000 for college, 34 percent end up in default. The default rate steadily drops as borrowing increases. Among the small group (just 3 percent) of those borrowing more than $100,000, the default rate is just 18 percent.
What does this all mean for loan policy? Getting students to borrow less is not an obvious path to reducing default, since 51 percent of defaulters left college with less than $10,000 in student loans.

Monday, August 31, 2015
Most Profitable Private US Businesses Ranked By Profit Margins
From Sageworks, Data Releases, "The Most Profitable Industries in the US:"
Sageworks today released its annual ranking of the most profitable industries in the U.S. Accounting firms, real estate lessors, and auto equipment leasing were at the top of the list. Companies operating in these three industries are seeing average net profit margins greater than 15 percent, or more than double the private-company average. Also well-represented on the list are companies in the professional services sector and industries related to renting/leasing and health care. A separate ranking of the most profitable small business industries is also included in this report. This list focuses on businesses with less than $5 million in annual revenue.
The analysis in this report is based on private-company financial statements filed over the 12 months ended August 27th, 2015. and uses net profit margin as the metric by which each industry is ranked. Net profit margin has been adjusted to exclude taxes and include owner compensation in excess of their market-rate salaries -- adjustments commonly made to private-company financials in order to provide a more accurate picture of the companies’ operational performance.
The Most Profitable Industries In The U.S.
Source: Sageworks *** With a few exceptions (warehousing, support activities for mining), the list of most profitable small business industries very closely mirrors the overall ranking. The full small business list, which focuses on companies with less than $5 million in annual revenue, is included below.
The Most Profitable Small Biz Industries In The U.S.
Source: Sageworks


Thursday, August 27, 2015
Is The SEC Violating Public Company Commercial Free Speech Rights By Regulating Interim Operating Results Disclosure?
My posted comment to The Wall Street Journal, "Let Tim Cook Speak (About Business): Apple’s CEO becomes a target of regulatory action for reminding investors that the real world exists." by Holman W Jenkins, Jr:
When the SEC was created in the 1930s, our free speech rights were more limited and government was allowed to enact laws restricting free speech. It is really only since the 1960s that our current view of expansive free speech was approved by the US Supreme Court.
In 1976, the US Supreme Court said commercial speech has first amendment protection and in 1980, the court set out a four part test when commercial speech can be regulated.
A first amendment challenge to laws and SEC rules limiting public companies from disclosing material information about their current operating results, which are necessary for the real-time accurate pricing of publicly traded securities, would give the US Supreme Court a chance to balance the rights of investors to have current and timely information to price securities against the government's right to delay disclosure for market regulatory reasons. A court could easily find that the SEC has overreached and its disclosure prohibitions are too broad.
Tuesday, August 25, 2015
Cities Passing Higher Minimum Wage Are Exempting Unions From Requirement: Allowing Unions, But Not Non-Unionized Businesses, To Negotiate A Lower Starting Wage For New Members
From The Wall Street Journal, "More Minimum-Wage Backfires: Wal-Mart earnings dip, while unions win wage-law exemptions." in Opinion:
The campaign for higher minimum wages continues to inflict damage on business employees and owners. About the only ones not feeling the pain are the labor unions that back this movement. Meanwhile, in a growing number of U.S. jurisdictions, unions are succeeding in exempting themselves from the laws they seek to impose on everyone else.*** But don’t expect pity from the leaders of organized labor, who are busy making sure they don’t have to play by the rules they’re demanding for everyone else. Cities including Chicago, Milwaukee, San Francisco and San Jose have exempted union contracts from laws mandating higher minimum wages.
Union chiefs say the laws unduly limit their flexibility to negotiate labor contracts, which are governed by federal law. And perhaps they don’t care what the wage is so long as they can collect dues. Or maybe they want the ability to give higher wages to longtime union members while dictating lower pay for new members. Flexibility on wages could also be a useful tool to persuade management to accept a unionized workforce, with a demand for higher pay coming later. But why shouldn’t workers who choose not to join a union enjoy the same freedom?
Saturday, August 22, 2015
Comparison Of Federal Reserve GDP Projections Versus Actual GDP: GDP Bonds Anyone?
From The Wall Street Journal, Opinion, "A Fine Fed Mess: Are financial assets falling to match the slowing real economy?"
Market-Based Solutions
There are market-based solutions that would improve the forecasts of GDP, that do not involve model building or a dependency on a particular school of economics. Event-based financial instruments where the amount of the payout is directly and computationally dependent on observable economic indicators, observable prices or observable outcomes, such as election outcomes in the Iowa Electronic Markets, inflation forecasts of US Treasury TIPS and other prediction-based actively traded instruments are more accurate than model-based forecasts.
A US Treasury GDP bond of different maturities, where payouts are computationally dependent on actual reported GDP of different time periods, would allow for the computation of future expected (forward) GDP growth rates. These forward growth rates, if they behave like other prediction market-based forecasts, will have greater accuracy than any model based forecast, including a Federal Reserve model.
One has to wonder why the Federal Reserve has not promoted the idea of a market-based, GDP dependent, financial instrument to improve the accuracy of its GDP forecast and to allow for computation of expected GDP growth rates for many different future time periods. Is it a fear of immediate accountability and feedback? The ability of investors to read real-time, market-based forecasts of the future of the US economy from a GDP-based bond would provide a level of oversight, feedback and accountability to the Federal Reserve's actions and judgments to improve future GDP growth that the Federal Reserve is not used to having.
Source: The Wall Street Journal

Market-Based Solutions
There are market-based solutions that would improve the forecasts of GDP, that do not involve model building or a dependency on a particular school of economics. Event-based financial instruments where the amount of the payout is directly and computationally dependent on observable economic indicators, observable prices or observable outcomes, such as election outcomes in the Iowa Electronic Markets, inflation forecasts of US Treasury TIPS and other prediction-based actively traded instruments are more accurate than model-based forecasts.
A US Treasury GDP bond of different maturities, where payouts are computationally dependent on actual reported GDP of different time periods, would allow for the computation of future expected (forward) GDP growth rates. These forward growth rates, if they behave like other prediction market-based forecasts, will have greater accuracy than any model based forecast, including a Federal Reserve model.
One has to wonder why the Federal Reserve has not promoted the idea of a market-based, GDP dependent, financial instrument to improve the accuracy of its GDP forecast and to allow for computation of expected GDP growth rates for many different future time periods. Is it a fear of immediate accountability and feedback? The ability of investors to read real-time, market-based forecasts of the future of the US economy from a GDP-based bond would provide a level of oversight, feedback and accountability to the Federal Reserve's actions and judgments to improve future GDP growth that the Federal Reserve is not used to having.
Friday, August 21, 2015
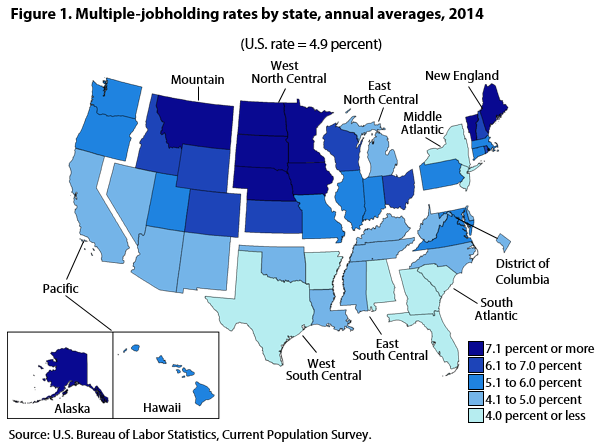
Multiple Job Holding Rates By State: Map
From Bureau of Labor Statistics, Monthly Labor Review, "Multiple jobholding in states in 2014: Multiple-jobholding rates at the state and regional levels vary considerably from the national average." by Susan Campolongo:
In 2014, the multiple-jobholding rate (the percentage of individuals who hold more than one job) in individual states varied considerably from the national average of 4.9 percent, a rate that has been unchanged since 2010. (See figure 1 and table 1.) In all, 22 states had multiple-jobholding rates significantly higher than the national average, 11 states had significantly lower rates, and 17 states and the District of Columbia had rates that were not significantly different from the U.S. average.
"
Source: Bureau of Labor Statistics
[Table 1 omitted.]
Multiple-jobholding rates tended to vary by region. As in past years, northern states generally had higher rates than southern states. All states in the West North Central Census division and all but one of the states in the New England division had multiple-jobholding rates significantly higher than the U.S. average. Seven of the eleven states with multiple-jobholding rates significantly below the national average were located in the South region. [Footnotes and tables omitted.]
Subscribe to:
Posts (Atom)