Inequality doesn’t mean you have no food; no home; no access to medical care; no indoor plumbing; no cellphone; no flatscreen tv; no opportunity for schooling for your children. Inequality and poverty are two different concepts. Inequality means there are some people that have more expensive versions than other people. Inequality measurements are used as motivation to create government dependencies; to increase taxes on the rich; to redistribute income and wealth. Inequality will always exist because wages are not age and skill adjusted. Someone just starting out will earn less than the other worker who has worked for 10, 20, 30 years and developed skills, experience and achieved wage raises and promotions. Someone working part-time will make less than someone working full time. Someone choosing to work at a non profit will usually make less than someone working for a non-government profit making company. Inequality measurements in today’s society are an attempt to motivate the citizenry to accept a socialist agenda of government income redistribution. Unfortunately, the more socialistic an economy becomes, the slower the growth rate of the economy and the poorer the nation and future generations become over time compared to a capitalistic entrepreneurial society.
Friday, December 30, 2022
Wage Inequality Will Always Exist: Inequality And Poverty Are Two Different Concepts: My Comment To WSJ Article, "Wage Inequality May Be Starting to Reverse"
My posted comment to The Wall Street Journal article, "Wage Inequality May Be Starting to Reverse: Remote work, deglobalization, stalled technology have started eroding some advantages of higher-skilled workers. The question is whether it will last." by Greg Ip:
Tuesday, December 27, 2022
Inequality Measures Promote Socialism, Income Redistribution, Continual Taxation Of The Rich: Comment To WSJ Book Review
My published comment to The Wall Street Journal, Books & Arts, "‘The Myth of American Inequality’ Review: Believe Your Eyes, Not the Statistics: Official government measures greatly exaggerate income inequality by ignoring taxation and noncash sources of income." by Charles W. Calomiris:
Inequality is not poverty. An inequality statistic does not measure the standard of living of those in the bottom rungs of the income distribution. It measures the income gap between the rich and those with lower incomes. Instead of calling it an inequality measure, it should be called an envy measure. Inequality compares an owner of a 4 year old Chevy, Ford, Toyota, Honda, Subaru against an owner of a new top of the line Tesla, BMW, Mercedes. It compares a renter of a modest apartment or owner of a modest size condo or home against a multi million dollar mansion. Inequality measures promote socialism, income redistribution and continual taxation of the rich, but fails to measure the needs and standard of living (consumption) of those in a lower quintile or decile.
Saturday, December 24, 2022
US One-Year Population Growth By State: 2021-2022: Chart
From The Wall Street Journal, "Real Time Economics" newsletter email by Jeff Sparshott, "U.S. Population Growth Remains Sluggish:"
 |
| Source: WSJ, Real Time Economics |
Friday, December 23, 2022
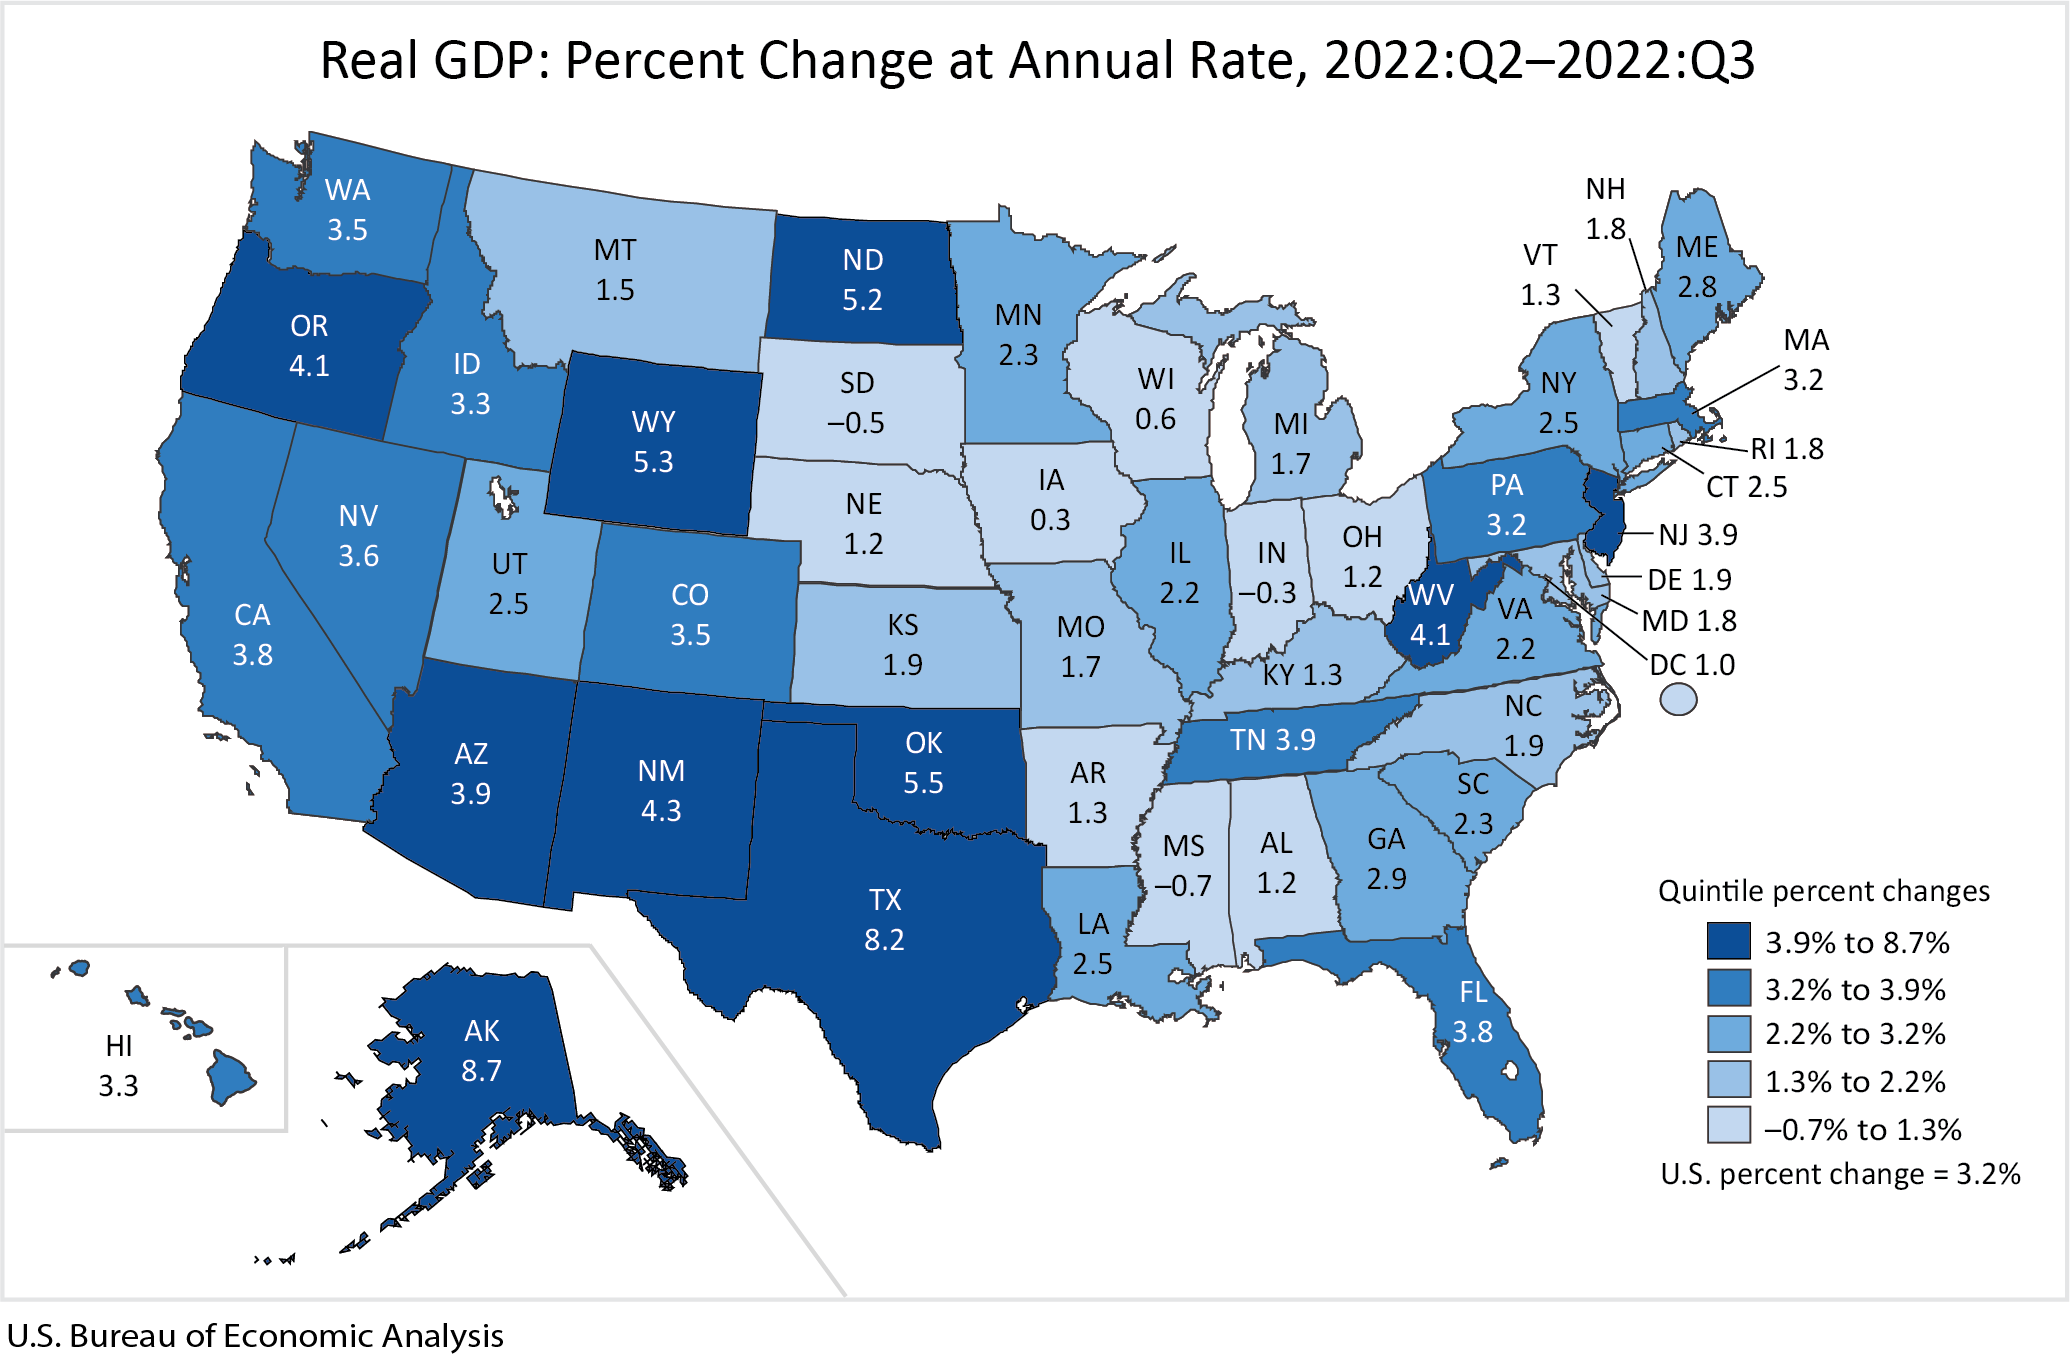
Gross Domestic Product And Personal Income By State, 3rd Quarter 2022: BEA Maps
From Bureau of Economic Analysis, News Release, "Gross Domestic Product by State and Personal Income by State, 3rd Quarter 2022:"
***
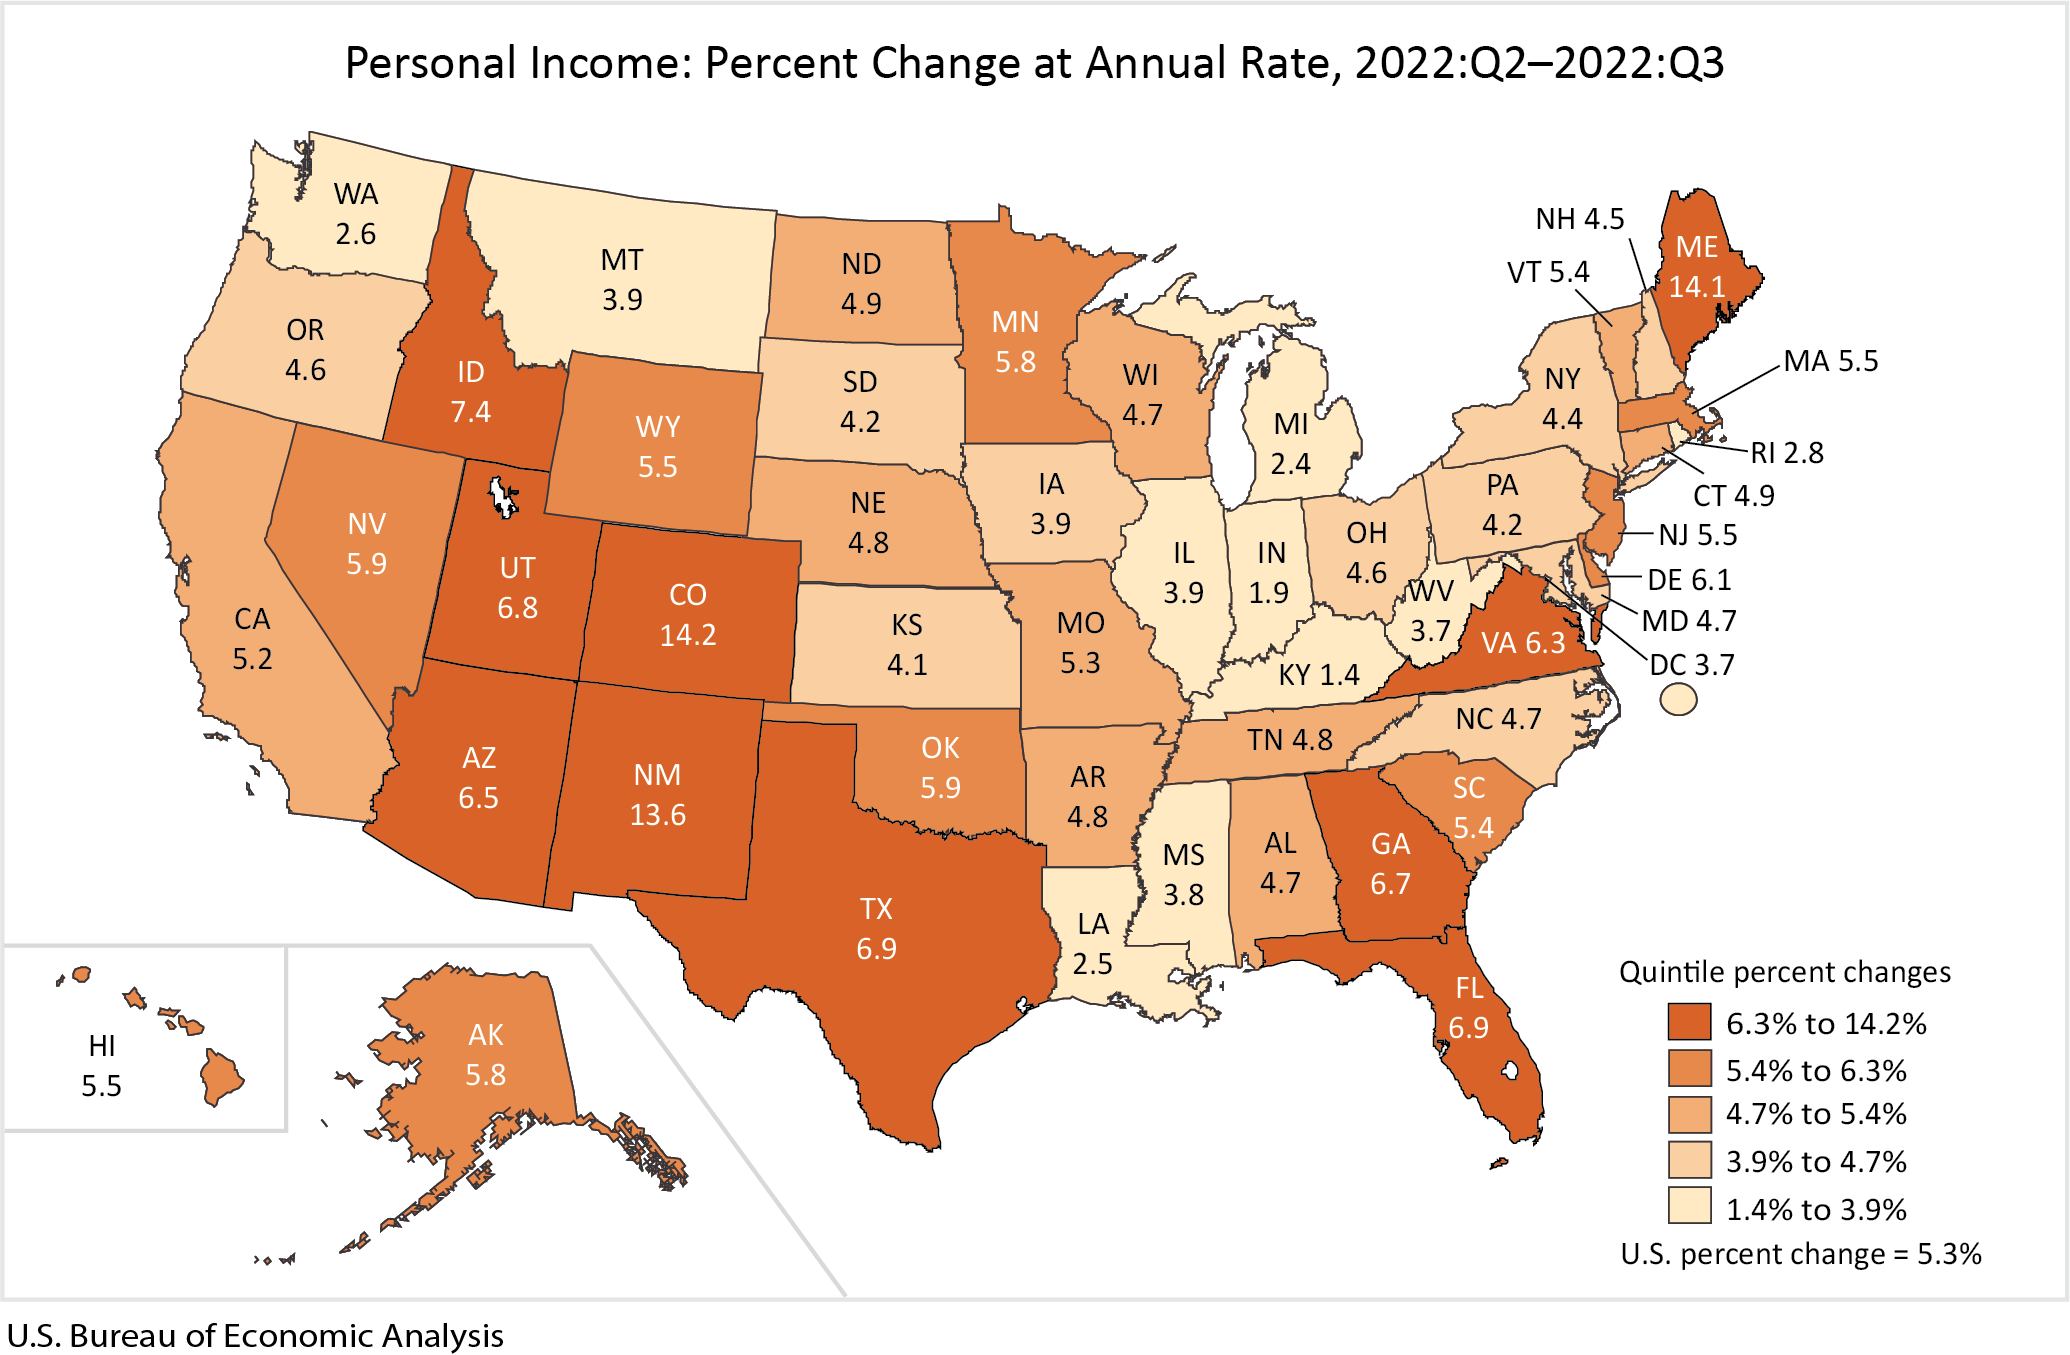
Real gross domestic product (GDP) increased in 47 states and the District of Columbia in the third quarter of 2022, with the percent change in real GDP ranging from 8.7 percent in Alaska to –0.7 percent in Mississippi (table omitted), according to statistics released today by the U.S. Bureau of Economic Analysis (BEA).*** Personal income increased in all 50 states and the District of Columbia in the third quarter, with the percent change ranging from 14.2 percent in Colorado to 1.4 percent in Kentucky (table omitted).
 |
| Source: Bureau of Economic Analysis |
Personal income In the third quarter of 2022, state personal income increased at an annual rate of 5.3 percent across all 50 states and the District of Columbia.
 |
| Source: Bureau of Economic Analysis |
Monday, December 19, 2022
Friday, December 16, 2022
US Consumer Oct-Nov 2022 Retail Sales Change By Category: Chart
From The Wall Street Journal, "Real Time Economics" newsletter email by Jeff Sparshott:
 |
| Source: Real Time Economics, WSJ Newsletter |
Tuesday, December 13, 2022
Import Shipping Points Of Entry Moving Away From West Coast: Chart
From The Wall Street Journal, "California Long Ruled U.S. Shipping. Importers Are Drifting East.
Companies that depended on the West Coast as a point of entry for their goods are turning to other parts of the country as global trade gets upended" by Paul Berger and photographs by David Walter Banks:
***
The hierarchy of U.S. ports is getting shaken up. Companies across many industries are rethinking how and where they ship goods after years of relying heavily on the western U.S. as an entry point, betting that ports in the East and the South can save them time and money while reducing risk.
Their reasons range from fears of a dockworkers strike along the West Coast and a repeat of the bottlenecks that roiled supply chains early in the pandemic to a reduced dependence on Chinese production and the need to get products to all parts of the country faster.
In August, Los Angeles lost its title as busiest port in the nation to the Port of New York and New Jersey as measured by the number of imported containers. It trailed its East Coast rival again in that measure during September and October, according to the Pacific Merchant Shipping Association and ports data.

Monday, December 12, 2022
Reprint: Political Nonsense Of Linking Specific Taxes To Specific Programs
Reprint of my 11 year old, December 5, 2011 post, "Political Nonsense Of Linking Specific Taxes To Specific Programs."
Monday, December 5, 2011
Political Nonsense Of Linking Specific Taxes To Specific Programs
All tax revenues and fees go into a general revenue pot to pay for all government programs and expenses. To say that a specific tax is for a specific program is just silly political theater and under Obama, divisive class warfare.
Identifying taxes for targeted programs is like putting cash into a bank account, then making a withdrawal a few weeks later and expecting the serial numbers on the currency withdrawn to be the same as on the cash previously deposited.
It is like going on a driving trip and noticing that the gas tank is half full, filling the tank up and expecting to use the new gas for the later part of the trip and the gas that was originally in the tank for the beginning part of the trip, as if the gas did not mix in the tank.
The government works the same way. No specific tax can pay for any specific program. The government takes in a total sum of money from taxes and fees and spends that money on all its programs and expenses. Any extra money left over is a surplus and any shortfall of funds is a deficit that must be borrowed.
Opportunity Cost of Taxes And Programs
Any new tax or revenue increase whether linked to a new program or not is deficit reducing. Any new program whether linked to a specific tax or not is deficit increasing. By joining taxes and programs together as a single item, politicians are hiding from the public and media that new programs are spending and deficit increases and that new taxes and ending existing programs are deficit reductions.
New taxes justified as the basis for new programs, ignores the lost opportunity of using the new taxes to reduce the deficit. Likewise, failing to end an existing program, ignores that the termination of that program would also reduce the budget deficit.
All existing programs are deficit increases because ending any program would reduce the deficit. Likewise, any new tax revenue is deficit reducing and failing to increase revenues is an increase in the deficit.
Monday, November 21, 2022
Friday, November 11, 2022
Why Is Inflation Still Here: Wall St Journal Video
Video from The Wall Street Journal, "Why Inflation Has Lasted for So Long: Pent-up demand and a tight job market have kept prices climbing" by Wall Street Journal, Nov 10, 2022 10:30 am:
In 2021, officials thought that high inflation would be temporary. But a year later, it was still near a four-decade high. WSJ’s Jon Hilsenrath explains three factors that have kept inflation up for longer than expected. Illustration: Jacob Reynolds
Tuesday, October 25, 2022
Government Regulated Programs To Lower Consumer Medical Costs Increase Patient Social Costs: Reprint of 2009 Blog Post
A reprint of my March 13, 2009, blog post "Government Regulated Medical Programs Create Social Costs:"
Friday, March 13, 2009
Government Regulated Medical Programs Create Social Costs
Both cost effectiveness and comparative effectiveness of medical treatments do not consider the economic social costs imposed on the patient. These studies do not save money. They shift the costs from the medical system to the patient as social costs that have a measurable dollar value. The studies do not include these social costs.
For example, there are often two or more antibiotics to treat an infection. One is usually an older antibiotic that is cheaper and the other is newer and much more expensive. The older antibiotic often will eradicate some, but not all of the possible bacteria. The newer antibiotic will often eradicate a much broader range of bacteria in a shorter course of treatment time.
In a cost or comparative benefit comparison, the recommendation is always to prescribe the older antibiotic first. It is the cheaper. If the first antibiotic is unsuccessful, the uncured patient returns to the doctor after making another appointment. It is at the second appointment that the doctor writes the prescription for the second antibiotic.
The comparative and cost benefit analyses do not include the costs imposed on the patient. In our example, the costs imposed on the patient such as time off from work to go to the second doctor visit are not included. The social costs to the patient of the discomfort and suffering from the uncured ailment are not measured. The increased risks to the patient of having the ailment for a longer time such as having the infection spread, etc. are not included in the costs. The delay and wait time until a curable treatment is implemented is not measured in these studies.
The lack of measuring social costs in any government managed or regulated medical system allows the government to say it is saving money. When the studies include the dollar value of social costs, such as rationing, treatment and diagnosis delays, need for additional treatments and the risk of a worsening medical condition, the benefits of cost and comparative analyses disappears.
Remember, there is no free lunch. The profit motive constantly pushes all companies, even the medical providers, continually to reduce their costs as much as possible to maximize their profits. Part of the costs we pay enable us as patients to have quick access to doctors and quickly [sic] effective treatment. To reduce costs in the medical system means that some costs will shift out of the medical system to the consumer as social costs. The costs shifted to us will include rationing, delays, denials, older and cheaper medicines and technologies.
Tuesday, October 18, 2022
International Tax Competitiveness Index 2022: Tax Foundation Chart
From Tax Foundation, "International Tax Competitiveness Index 2022" by Daniel Bunn and Lisa Hogreve [Chart at end]:
***
The structure of a country’s tax code is a determining factor of its economic performance. A well-structured tax code is easy for taxpayers to comply with and can promote economic development while raising sufficient revenue for a government’s priorities. In contrast, poorly structured tax systems can be costly, distort economic decision-making, and harm domestic economies.*** A competitive tax code is one that keeps marginal tax rates low. In today’s globalized world, capital is highly mobile. Businesses can choose to invest in any number of countries throughout the world to find the highest rate of return. This means that businesses will look for countries with lower tax rates on investment to maximize their after-tax rate of return. If a country’s tax rate is too high, it will drive investment elsewhere, leading to slower economic growth. In addition, high marginal tax rates can impede domestic investment and lead to tax avoidance.
According to research from the OECD, corporate taxes are most harmful for economic growth, with personal income taxes and consumption taxes being less harmful. Taxes on immovable property have the smallest impact on growth.
Separately, a neutral tax code is simply one that seeks to raise the most revenue with the fewest economic distortions. This means that it doesn’t favor consumption over saving, as happens with investment taxes and wealth taxes. It also means few or no targeted tax breaks for specific activities carried out by businesses or individuals.
 |
| Source: Tax Foundation |
Tuesday, October 4, 2022
My Posted Comment to WSJ Opinion, "What Role Should Race Play in Admissions?"
My posted comment to The Wall Street Journal Opinion, "What Role Should Race Play in Admissions? ‘Holistic’ policies put Asian-Americans at a disadvantage, and they’re fighting back." by William A. Galston:
Increasing the admitted Harvard class enrollment of an underrepresented minority can be done without decreasing the admitted number of other racial/ethnic groups through expansion and increasing total enrollment. Instead, Harvard chose the discriminatory method of increasing a minorities representation by decreasing the enrollment of another racial/ethnic group. Consistently favoring one racial ethnic group over another is unlawful discrimination. Harvard has had plenty of time since the 1978 US Sup Ct Bakke decision to raise funding and expand its facilities to allow for an increase in underrepresented minorities without decreasing any other racial/ethnic group’s admission rate. Harvard chose a discriminatory solution that limits the total enrollment of all minorities by forcing one member of a minority group to give up a seat for another minority group.
Tuesday, September 13, 2022
Why Medical Costs Don't Go To Infinity: Connection Between High Medical Prices, Per Capita GDP And US Productivity: Reprint Of My 11 Year Old Blog Post
A reprint of my September 21, 2011 blog post about the Connection Between High Medical Costs, Per Capita GDP And US Productivity:
Wednesday, September 21, 2011
Connection Between High Medical Costs And US Productivity
A comment I posted on Code Red, "Why Aren’t Medical Prices Infinity?" by dranove:
Potential productivity and per capita GDP loss to the household measured from the onset of the medical condition's negative impact on production, and not first doctor visit, set an upper bound on the value (price, opportunity cost) of the medical service.
For example, suppose a member of a household has a bad knee, which would improve with proper medical care. The bad knee either directly negatively affects the worker's output or if it occurs in a non-working family member, requires a working family member to lower his/her productivity by devoting time to the ill family member for care, transportation to doctor, etc, as would be the case for a child, elder parent, severely ill family member.
The opportunity cost of the lost production starts from the onset of the condition, and not from time of first doctor visit, and ends when the condition is sufficiently resolved to allow productivity to go back to its pre-symptom level.
The US has high productivity and GDP per capita.
Delays in getting doctor appointments, delays in diagnostic tests, delays in accurate diagnosis, delays in EFFECTIVE treatment (specialists), need for retreatment and long recovery times are opportunity costs to the affected worker.
Comparative medical access and recovery times are shorter in the US than in other countries. You cannot have short access times to medical care without excess capacity.
In other countries, the costs of delayed doctor appointments, diagnoses and treatments are not captured in the prices paid for medical services. In the US, the costs of avoidance of the social costs, the opportunity costs of delayed or incorrect medical care is captured in US medical prices.
Even if other countries captured these costs in their medical care prices, the higher US per capita GDP and productivity would still make the US medical services prices higher.
Wednesday, September 7, 2022
How CBO Forecasts Inflation
From CBO, "How CBO Forecasts Inflation," September 7, 2022, Presentation by Bob Arnold, Unit Chief in CBO's Macroeconomic Analysis Division, to the Society of Actuaries:
Tuesday, July 19, 2022
Understanding Productivity Growth: CBO’s Most Recent 10-Year Projections Of Potential Output And Total Factor Productivity
From CBO, "CBO’s Economic Forecast: Understanding Productivity Growth" July 19, 2022 Presentation by Aaron Betz, an analyst in CBO’s Macroeconomic Analysis Division, at the NABE Foundation's 19th Annual Economic Measurement Seminar:
CBO regularly publishes economic projections that are consistent with current law—providing a basis for its estimates of federal revenues, outlays, deficits, and debt. A key element in CBO’s projections is its forecast of potential (maximum sustainable) output, which is based mainly on estimates of the potential labor force, the flow of services from the capital stock, and potential total factor productivity in the nonfarm business sector. This presentation describes CBO’s most recent 10-year projections of potential output, highlighting the importance of potential total factor productivity. It discusses the historic slowdown of growth in total factor productivity, as well as changes in total factor productivity during the 2020–2021 coronavirus pandemic, and it explores possible explanations for the slowdown and implications for the future.
Wednesday, July 6, 2022
Limits On Modeling The Macro-Economy: Reprint Of My 12 Year Old Blog Post
A reprint of my Feb 18, 2010 blog post about the Limits Of Econometric Models:
Thursday, February 18, 2010
Limits Of Econometric Models Of The Macro-Economy
The following is a comment I posted On Econlog, "Macroeconometrics and Science" by Arnold Kling about the limits of econometric models of the macro-economy.
There is also the "Lucas Critique". Lucas said that economic models derived from historical data could not be used to recommend effective changes to government policies because the past relationships in the data are dependent on the effects of policies in place at the time of the data. Predictions based on past data will miss the effects of new policies and produce incorrect predictions unless the relationships in the model are calibrated for the new policy. One needs to build a model where the internal relationships (coefficients) vary depending upon policy recommendations. It requires an understanding (or at least an assumption) on how policy affects economic outcomes. It can become a tautology. The model predicts what it is set to predict. If a model is calibrated to predict that policies A, B and C will move the economy to long term trend, then a recommendation to use policies A, B and C will show in the model that the economy is moving towards its long term trend. The model will become the basis for a recommendation that was assumed as part of the model in building the model.
Additionally, when models are not validated against out of sample data, there is the problem of data mining and spurious results. When a 100 economists run a 100 different, independent models on historical data looking for economic and theoretical explanatory relationships, even at a 90 percent statistical significance level, there will result 1000 (100x100x.1), different models that meet model acceptance criteria.
Out of sample data tests would drastically reduce the number of acceptable models from 1000 to a much lower amount. Those that survive may again be spurious, because at the 90 percent significance level, the probability is that 100 out of the 1000 will survive and look meaningful. These 100 models exist based on luck without any need for there to be any economic meaning to their internal relationships. They can even be inconsistent with each other and known economic theories.
Economists then derive explanations to match the model results instead of vice versa. Data mining and spurious models can lead to inconsistent policy recommendations among economists.
It is like a gambler's hot streak at the roulette table, where the bettor develops superstitions about why he is winning, such as color of his shirt, etc. Economic policies based on the surviving models are equivalent to a gambler's idiosyncratic behavior that he thinks changes the odds at the roulette table and enables him to win. Each gambler has a different reason for the winning streak. Like different schools of economists.
The scientific method is based on the concepts of hypothesis testing against data and reproducible results. Model building is the reverse. The data is used to derive the hypothesis and it is not tested against new data (out of sample) to see if it is reproducible.
Both the Ptolemy (Earth centric) and Copernican (Sun centric) views of planetary motion were internally consistent with the data on planetary motion known at the time. Both were accurate in predicting future planetary position (actually, Ptolemy's method, revolving around the Earth, initially was more accurate than the Copernican method).
However, it is extremely unlikely that Sir Isaac Newton could have developed his theory of gravity under the Ptolemy system. Newton's gravity requires rotation around the larger mass body, the Sun, and not the Earth. While an equivalent gravitational system could probably have been mathematically built in a Ptolemy system, it would not be as simple to comprehend or visualize as the Newtonian system.
Expectation theory is in many ways equivalent to Copernican theory, but that is another long and controversial discussion. Suffice it to say, many economic models are inconsistent with expectation theory.
The above is a comment I posted On Econlog, "Macroeconometrics and Science" by Arnold Kling.
[See my March 16, 2010 addendum post: "GDP Bond Addition To My February 18 Post 'Limits Of Econometric Models ...'"]
Thursday, June 30, 2022
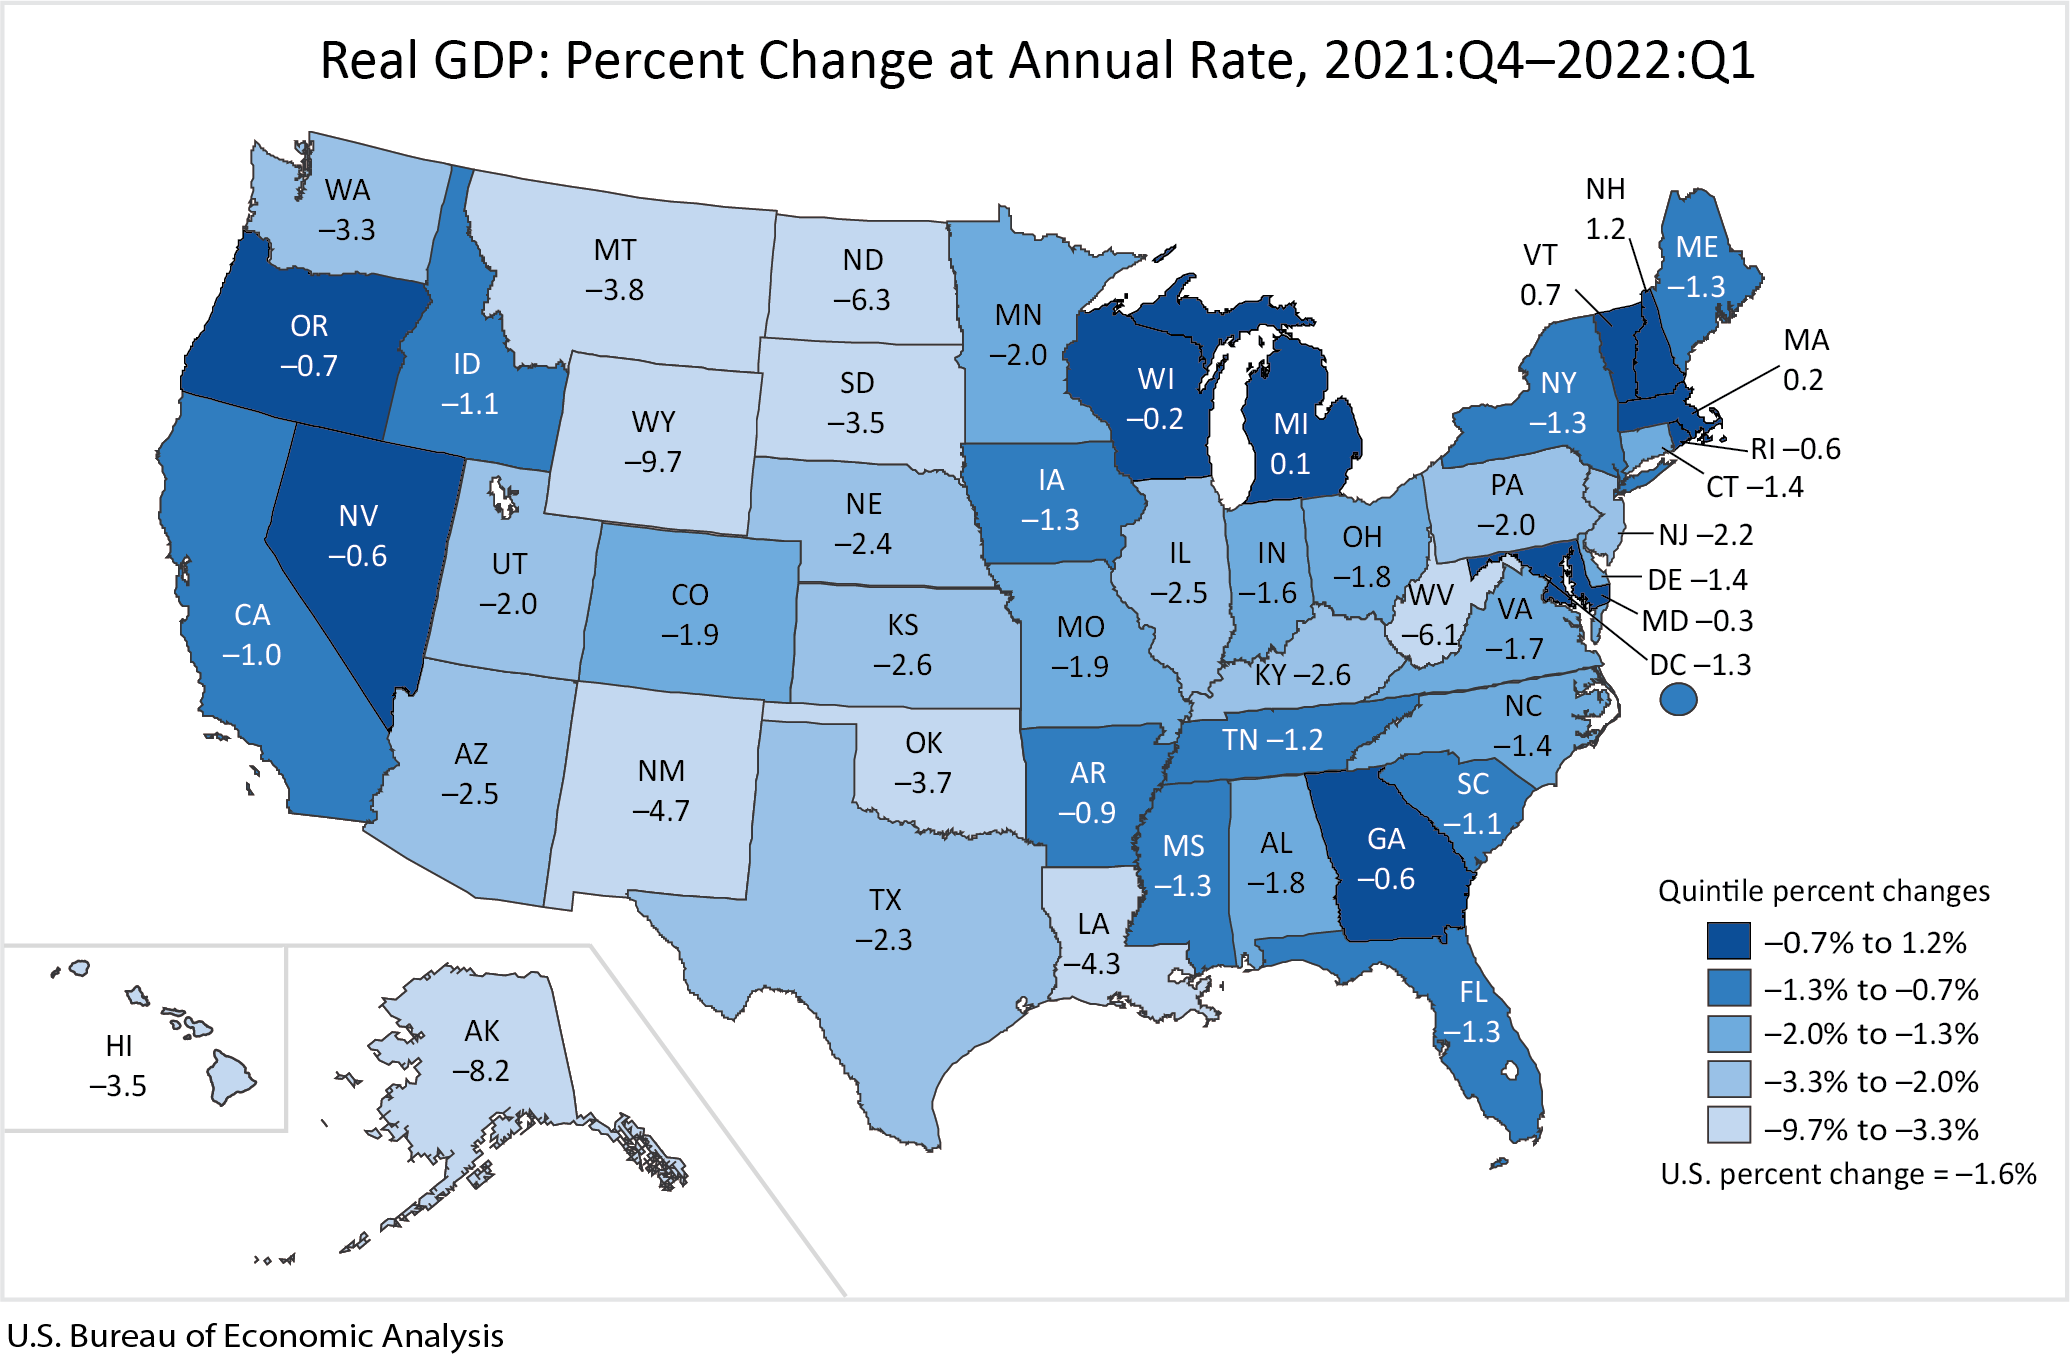
First Quarter US Real GDP By State: Map: US Bureau of Economic Analysis
From U.S. Bureau of Economic Analysis (BEA), News Release, "Gross Domestic Product by State, 1st Quarter 2022" Thursday, June 30, 2022:
Gross Domestic Product by State, 1st Quarter 2022
Real gross domestic product (GDP) decreased in 46 states and the District of Columbia in the first quarter of 2022, as real GDP for the nation decreased at an annual rate of 1.6 percent, according to statistics released today by the U.S. Bureau of Economic Analysis (BEA). The percent change in real GDP in the first quarter ranged from 1.2 percent in New Hampshire to –9.7 percent in Wyoming (table 1).
 |
| Source: U.S. Bureau of Economic Analysis |
Tuesday, June 28, 2022
Building A Company That Fails Is Easy: Building A Company That Lasts Is Difficult: Government Is Not Responsible For Business Success: Reprint of a Ten Year Old Blog Post
A reprint of my July 19, 2012 blog post about the incorrect belief government is responsible for successful companies follows:
Thursday, July 19, 2012
Building A Company That Fails Is Easy: Building A Company That Lasts Is Hard: Obama Is Wrong In Thinking Government Schools, Roads And Other Government Infrastructure And Services Are Responsible For Successful Companies: Romney Did Build Bain Without The Government
Anyone with enough cash; a valuable asset to sell or put up as collateral; with family and friends who will lend them money; or with the ability to borrow from a bank can start a company.
A thousand times everyday in the US, somebody decides they want to be in business for themselves. They think of an idea that will make them money. They make room in the den, garage, attic. They rent space, sign a lease, incorporate, sign partnership papers, file doing business as papers, pay necessary governmental fees, print business cards, think of logos, trademarks, advertisement slogans, create a company Facebook page and twitter account.
New businesses in the hundreds, if not thousands, start in someone's mind every day. Accountants, lawyers and bankers are contacted.
All it takes to start a business in the US is some money and an idea. Money allows an entrepreneur to lease space, hire workers, salesmen, accountants, lawyers. Money allows advertising, sample products, etc. Money allows a business to start. Money allows anyone to build a business.
What happens to most of these ideas, embryonic businesses, start-ups and future McDonald's, Microsoft, Google, GM, WalMart, etc? They die a quick death.
All the entrepreneurs' businesses that start and disappear used government services and infrastructure. The failed businesses hired people who used government schools, roads, and other government services and infrastructure.
Obama and the Democrats say government services and infrastructure are responsible for the business success of Romney and other entrepreneurs. By the same logic, government services and infrastructure are responsible for the business failures.
Romney's and other entrepreneurs' success is not at all due to anything supplied by government. New business success is due to the entrepreneurs' willingness to take more risk than the average individual, along with some unique innate entrepreneurial ability that is not learned in schools or we would not see the high failure rate of new businesses that we do. Of course, a little luck helps, but luck cannot turn a lousy business into a success.
Biil Gates, Mark Zuckerberg, Ray Kroc, Sam Walton, Larry Page, Sergey Brin and the thousands of other successful entrepreneurs are responsible for the success of their companies. They owe nothing to the government, government services and infrastructure for the success of their companies. Other entrepreneurs and start up companies in the same field doing the same thing, with the same government services and infrastructure as the successful business start-ups, failed and died prematurely.
Government provided services and support are not the essential ingredients for business success.
Monday, June 27, 2022
Socialism, High Taxes, Capitalism and Economic Sustainability: Reprint of a Six Year Old Blog Post
A reprint of my October 16, 2015 blog post about profit and economic sustainability follows:
Friday, October 16, 2015
What Socialists and High Tax Progressives Forget About Capitalism
Capitalism is nothing more than private ownership with a profit motive. Economic profits exist only after all costs are paid. Material, labor, and equipment costs, plus debt cost (interest and principal) and a fair return on invested monies must be paid regularly or a company will cease to exist. If there are no profits, then there is insufficient money to pay back completely the costs of material, labor, equipment, and debt and equity investment. Without profits, workers do not get fully paid; material and equipment suppliers do not get fully paid; lenders and investors do not get paid.
A company that cannot regularly pay back its costs will cease to exist. Workers will not work for free or partial wages. Suppliers will not supply it. Lenders will not lend to it and investors will not invest in it.
Capitalism enables business to be self-sustaining. It enables a company to pay back all its ongoing costs. Capitalism is a sustainable economic system. The companies that are not self-sustaining are removed and replaced with sustainable companies.
Not-for-profits and governments are not financially self-sustaining. They are not economically sustainable systems. Left on their own, they would cease to have funds and government printed money would be worthless. They always are in need of more outside funding. Not-for-profits are always planning fund raising campaigns to pay off expenses they have already incurred or will incur in the coming year. Governments are always looking for ways to increase fees and taxes and to rollover debt to pay for government employee salaries, government programs and the military. Governments and not-for-profits are dependent on a vibrant capitalistic system to create wealth and companies with profits. Without a dynamic fully functioning capitalistic system, governments will quickly run out of funds to tax and redistribute.
Not-for-profits and governments need a replenishable source of funds. Capitalism is the only economic system that can regularly generate a sustainable source of profit and wealth.
Taxes and income and wealth redistributions do not create income, profits or wealth.
Government interference through laws, regulation and taxes creates structural rigidities and additional expenses for businesses. In general, government reduces businesses ability to generate wealth and profits and adapt to changing business environments.
A government that increases business costs through restrictive laws and regulations and harshly taxes business and wealth will find itself unable to accomplish for its populace the very things it thought its laws, regulations and taxes would allow it to do. It will diminish its very source of sustainability. It will find that its source of funding is no longer as reliable and plentiful as it once was. It will find it cannot do what it set out to do through law, regulation and tax.
Wednesday, June 22, 2022
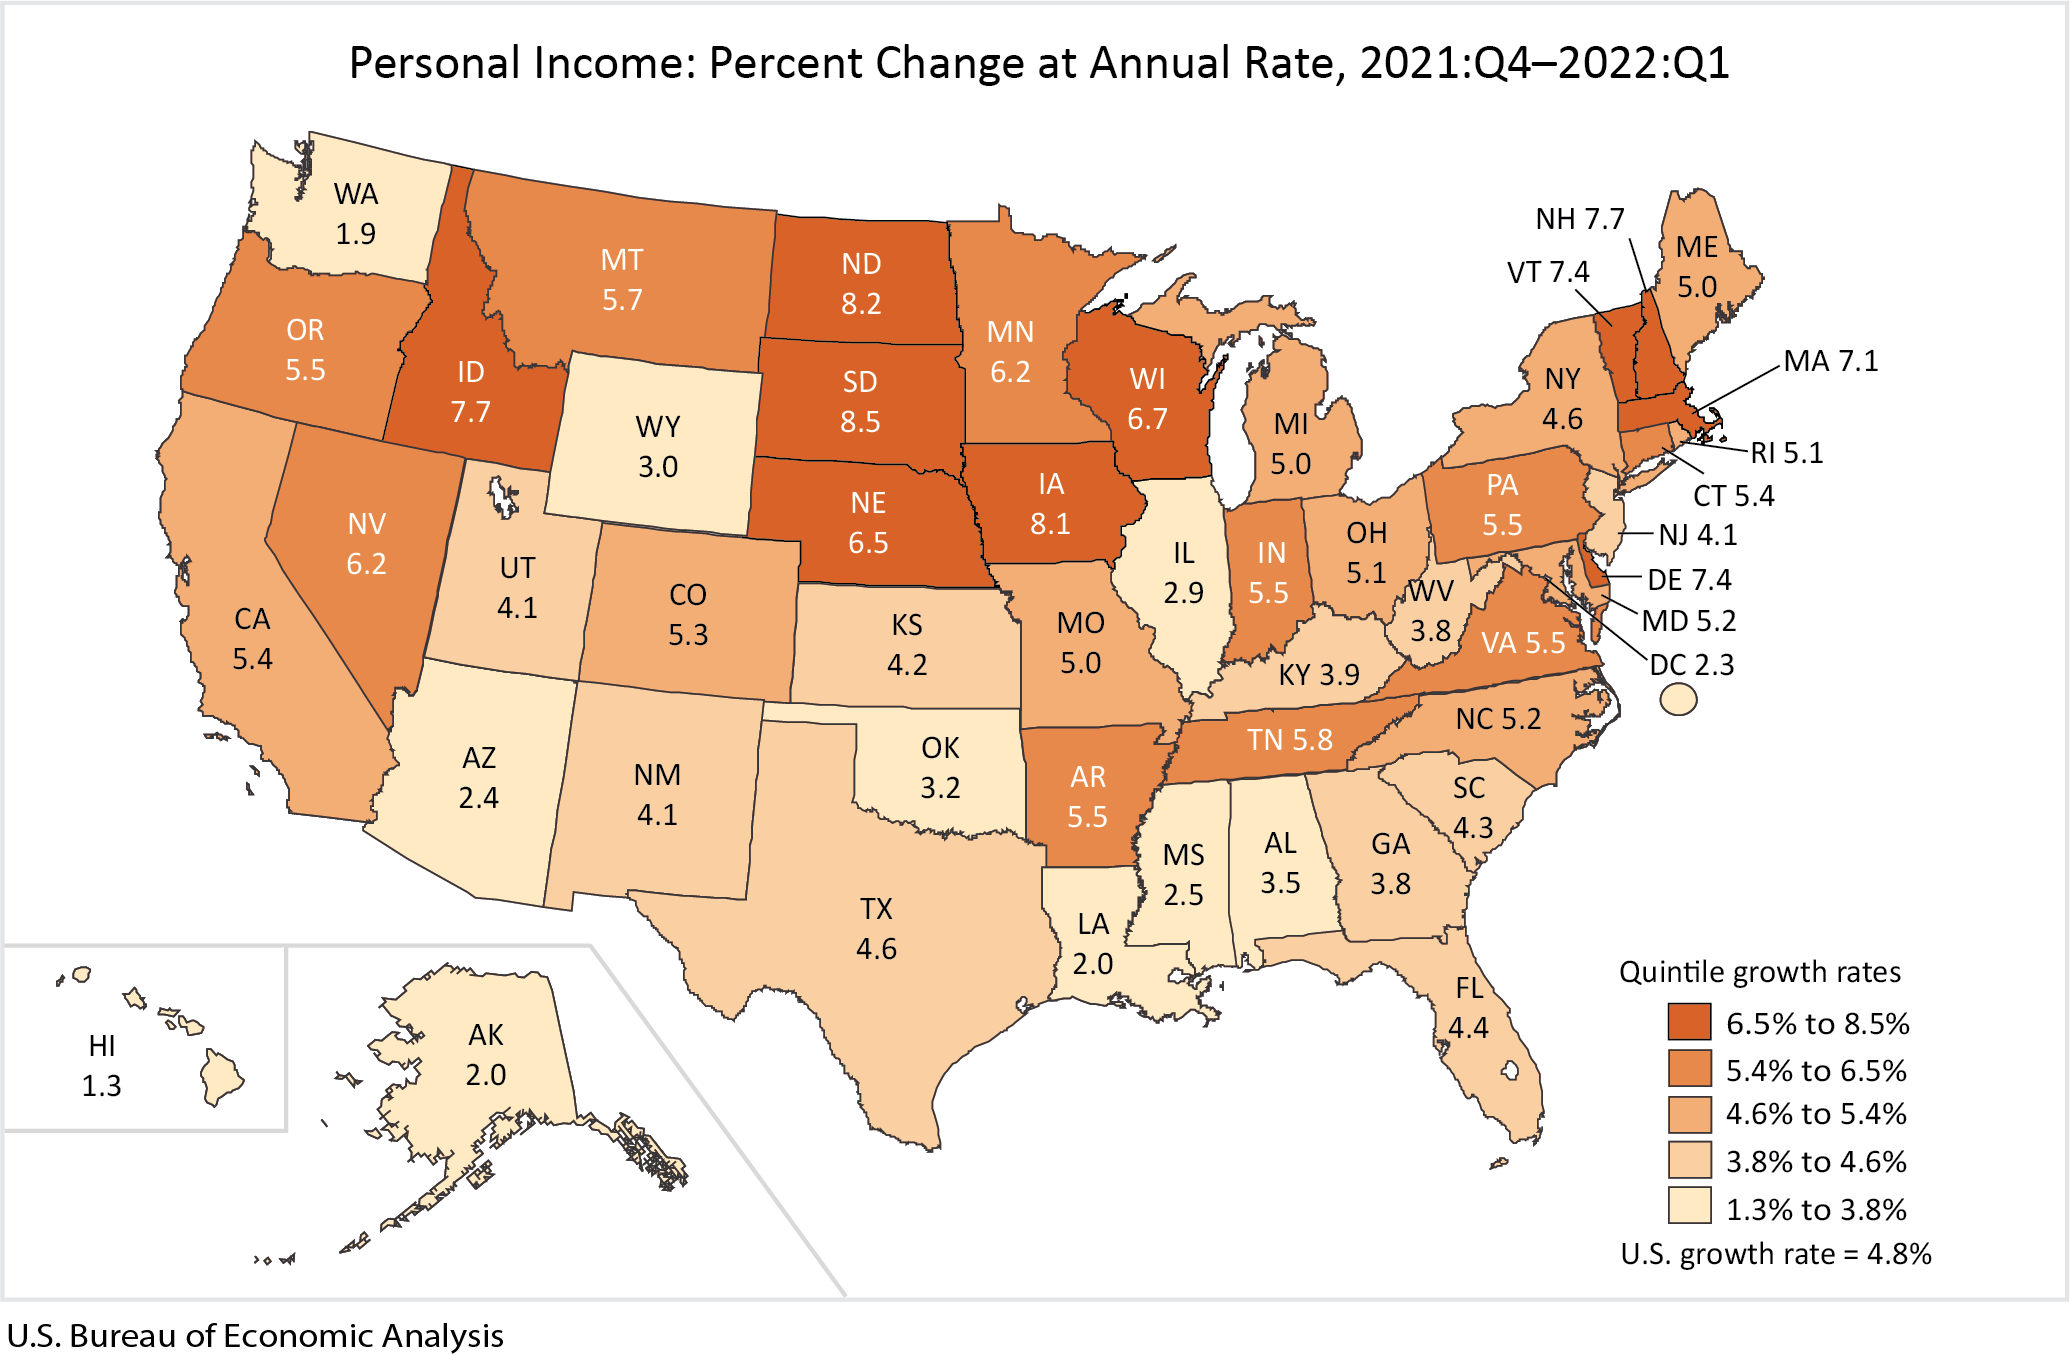
First Quarter US Personal Income By State: Map: US Bureau of Economic Analysis
From U.S. Bureau of Economic Analysis (BEA), News Release, "Personal Income by State, 1st Quarter 2022" Wednesday, June 22, 2022:
Personal Income by State, 1st Quarter 2022State personal income increased 4.8 percent at an annual rate in the first quarter of 2022 after increasing 3.6 percent in the fourth quarter of 2021, according to estimates released today by the U.S. Bureau of Economic Analysis (BEA) (table 1). The percent change in personal income across all states ranged from 8.5 percent in South Dakota to 1.3 percent in Hawaii.
Source: U.S. Bureau of Economic Analysis
Wednesday, June 15, 2022
Fed's Past GDP Projections Are Often Incorrect
A decade ago, the Federal Reserve was bad at estimating future GDP growth. Why should investors think that the Fed has improved its GDP forecasting ability?
A reprint below of my August 22, 2015, blog post, "Comparison Of Federal Reserve GDP Projections Versus Actual GDP: GDP Bonds Anyone?"
A reprint below of my August 22, 2015, blog post, "Comparison Of Federal Reserve GDP Projections Versus Actual GDP: GDP Bonds Anyone?"
Saturday, August 22, 2015
Comparison Of Federal Reserve GDP Projections Versus Actual GDP: GDP Bonds Anyone?
From The Wall Street Journal, Opinion, "A Fine Fed Mess: Are financial assets falling to match the slowing real economy?"
 |
| Source: The Wall Street Journal |
Market-Based Solutions
There are market-based solutions that would improve the forecasts of GDP, that do not involve model building or a dependency on a particular school of economics. Event-based financial instruments where the amount of the payout is directly and computationally dependent on observable economic indicators, observable prices or observable outcomes, such as election outcomes in the Iowa Electronic Markets [now defunct], inflation forecasts of US Treasury TIPS and other prediction-based actively traded instruments are more accurate than model-based forecasts.
A US Treasury GDP bond of different maturities, where payouts are computationally dependent on actual reported GDP of different time periods, would allow for the computation of future expected (forward) GDP growth rates. These forward growth rates, if they behave like other prediction market-based forecasts, will have greater accuracy than any model based forecast, including a Federal Reserve model.
One has to wonder why the Federal Reserve has not promoted the idea of a market-based, GDP dependent, financial instrument to improve the accuracy of its GDP forecast and to allow for computation of expected GDP growth rates for many different future time periods. Is it a fear of immediate accountability and feedback? The ability of investors to read real-time, market-based forecasts of the future of the US economy from a GDP-based bond would provide a level of oversight, feedback and accountability to the Federal Reserve's actions and judgments to improve future GDP growth that the Federal Reserve is not used to having.
Tuesday, June 14, 2022
The Budget and Economic Outlook: 2022 to 2032: CBO Presentation
From CBO, "The Budget and Economic Outlook: 2022 to 2032" Presentation by Christina Hawley Anthony, Robert Arnold, and Joshua Shakin, CBO Unit Chiefs, at a joint seminar by CBO and the Congressional Research Service, June 14, 2022:
Summary
CBO projects a federal budget deficit of $1.0 trillion in 2022 and an average annual shortfall of $1.6 trillion from 2023 to 2032, under the assumption that existing laws governing taxes and spending generally remain unchanged. Federal debt held by the public is projected to dip to 96 percent of GDP in 2023, but then to rise each year thereafter, reaching 110 percent in 2032, higher than it has ever been.
In CBO’s projections, elevated inflation initially persists in 2022 and then subsides as supply disruptions dissipate, energy prices decline, and less accommodative monetary policy takes hold. The price index for personal consumption expenditures increases by 4.0 percent in 2022, real (inflation-adjusted) GDP grows by 3.1 percent, and the unemployment rate averages 3.8 percent.
Thursday, May 19, 2022
Taylor Swift's Honest, Wise And Upbeat Commencement Speech To The 2022 NYU Graduation Classes After Receiving An Honorary Doctorate Degree: Video: Transcript
From NYU 2022 All-University Commencement, upon acceptance of her honorary doctorate degree, Dr. Taylor Swift's commencement speech to the 2022 graduating classes.[Her 23 minute speech starts at 2:51:23]
A full transcript of her speech is available on Billboard.
Thursday, May 12, 2022
"Is inflation here to stay?" And "Is inflation dead or hibernating?" 2022 And 2020 Speeches by Claudio Borio, Head of the Monetary and Economic Department of the Bank for International Settlements (BIS)
"Is inflation here to stay?"Speech by Mr Claudio Borio, Head of the Monetary and Economic Department of the BIS, at the Barclays 26th Annual Global Inflation Conference, 25 January 2022.
About a year ago I asked the question: is inflation dead or hibernating? The answer then was that it was merely in hibernation and today I think it's safe to say that this was the right call. But as I revisit the question today, the answer is more complex than one might think. In the short run, things clearly turned out quite differently than I and many others had expected, with higher and more persistent inflation taking hold in many economies. There are grounds for optimism, though, as the pandemic's bottleneck effects will dissipate at some point, secular disinflationary effects remain in place and central banks are there to prevent uncomfortably high inflation from becoming entrenched. But in the longer term, inflation could become a problem again if underlying economic conditions and policy regimes came to resemble those in the 1970s more: a deglobalised world; high public debt; financial repression; highly constrained central bank autonomy; and a larger role of the state in the economy."Is inflation dead or hibernating?" Speech by Mr Claudio Borio, Head of the Monetary and Economic Department of the BIS, at the Barclays 24th Annual Global Inflation Conference, 5 October 2020.
Is inflation dead or hibernating? The answer will shape the future of central banking and the global economy. It requires exploring shifts in the tectonic plates of the global economy rather than developments on its surface, ie shifts in secular forces and policy regimes. Looking back, obviously central banks have been instrumental in taming the Great Inflation of the 1970s. But this cannot be the whole story: post-Great Financial Crisis, inflation has remained stubbornly below targets despite major efforts to push it up. Inflation has been very insensitive to economic slack, and inflation expectations appear to be rather backward-looking. Arguably, secular forces such as globalisation and technology have played an important complementary role. Looking forward, in the wake of the pandemic, disinflationary forces are likely to prevail in the near term, owing to excess capacity and the continued impact of the secular forces. But at some point inflation could become a problem again, if underlying economic conditions and policy regimes came to resemble more those in the 1970s: a deglobalised world; high public debt; financial repression; highly constrained central bank autonomy; and a larger role of the state in the economy. If so, the winter of hibernation will have been quite long, but just a winter nonetheless.
Thursday, May 5, 2022
CBO Presentation On Use Of Dynamic Analysis
From CBO, "Dynamic Analysis at the U.S. Congressional Budget Office" May 5, 2022, Presentation by Theresa Gullo, CBO's Director of Budget Analysis, to the Organisation for Economic Co-operation and Development's Committee of Senior Budget Officials:
PDF doccument of slide presentation availble here.
Summary
CBO's cost estimates focus on the budgetary consequences of proposed legislation, and they generally reflect likely behavioral responses to a proposal—for example, changes in the likelihood that people will claim a government benefit. "Dynamic analysis" refers to something different: instances in which CBO takes into account further behavioral changes that would affect total output in the economy. Those broad macroeconomic changes—which include changes in the labor supply or private investment—resulting from changes in fiscal policy can themselves have additional budgetary consequences. Most legislation does not have significant macroeconomic effects, and by long-standing convention, such consequences are not generally reflected in CBO's cost estimates. [Emphasis added.]
In certain analyses other than cost estimates, CBO studies how proposals that would significantly change federal spending and tax policies would affect the overall economy, as well as how such effects would feed back into the federal budget. Such analyses provide a more complete assessment of a policy's budgetary impact, but are more complex and take more time.
PDF doccument of slide presentation availble here.
Friday, April 15, 2022
Why Good Schools And Poorly Performing Schools Stay That Way: Reprint of January 2010 Blog Post
A reprint of my January 25, 2010 blog post, "Why Good Schools And Poorly Performing Schools Stay That Way."
Monday, January 25, 2010
Why Good Schools And Poorly Performing Schools Stay That Way: Survivorship, Selection, Retention And Filtering Bias
I am in favor of more information about schools, teachers and student educational performance because I believe there is not enough accountability by school systems for the educational performance of students and because I believe desirable outcomes should be measured to allow for corrective feedback at all levels of the organization, including school, teacher and student.
I would think that parents and educators would want information that measured performance and also allowed for corrective actions. Too much information or the wrong set of information is not helpful.
It is individual teacher and individual student level longitudinal (over time) information, which is almost never forthcoming in any disclosure by school systems, that best measures a student's and a teacher's performance. Has the teacher been able to improve the student's performance over the year? Yes, good school for that student: No, bad school for that student.
A large data set of information maybe interesting for conversational topics but is costly both to the parents and the schools, in the sense that both must expend effort in learning which data is useful information for improving student performance and which data is extraneous information.
The problem with aggregated non-specific student and non-specific teacher information is that over any time period the students and the teachers change and comparisons of increasing or decreasing test scores are made against two different groups. This year's graduating students with teacher group A are compared to last year's graduates with teacher group B, for example, without knowing if comparison of the two groups is valid.
There are indications in educational performance data that there is selection and filtering bias, which interferes with the usefulness of the information for parent decision-making. For example, schools with high scores tend to demand a commitment to more schoolwork than lower performing schools and also over other student interests. Do parents and children who want more schoolwork move into these school areas and produce higher test scores or do the schools and teachers. Whether better performing schools, in the sense of higher student scores, attract better achieving students or produce better achieving students is often ambiguous from most studies of performance. Do good students make schools look better on tests or do good schools make students look better on tests?
There are also indications that schools signal which students they want to enroll, which students they want to keep, and which students' families they want to move to another school area. In the US, it is sometimes as simple as whether the school highlights the winning science fair participants or the football team, but often the signals are much more subtle and less obvious. There is a survivability bias. Good schools may look better than other schools because they are better at enrolling, separating and retaining the higher performing students, and the poorer performing students move away from the school. Educational studies almost never control for survivorship bias.
Any educational information to be useful to parents has to allow them to choose a school that would benefit THEIR child. The current state of educational information about schools does not offer information to anyone that allows changes to be made to a school to improve its performance for any fixed student body. Yes, school scores can be improved but it is often by selecting a better performing group of students for testing and not by actually improving student performance. If it were easy to make improvement changes or if people really knew, what changes to make to improve schools, student outcomes at all schools, even poor performing schools, would be improved a long time ago.
The data is unreliable for recommending changes to schools to improve student outcomes and that is why student performance is deteriorating in many schools. It is also why every recommendation that has come out of previous data studies has failed to produce the desired results of significantly improving student test score outcomes.
I posted an almost identical comment on Core economics blog, "What has transparency ever done for us?" by Joshua Gans.
Tuesday, April 12, 2022
15 Percent Ethanol Gasoline (E15) Has Greater Vehicle And Engine Use Limitations Than 10 Percent Ethanol Gasoline (E10): E15 Gets Fewer MPG Than E10: Recent Study Questions Global Warming Benefit Of Ethanol Fuel
From U.S. Department of Energy, Office of Energy Efficiency, www.fueleconomy.gov, the official U.S. goverment source for fuel economy, "Ethanol:"
Recent Study Finds Ethanol More Cartbon Intensive Than Plain Gasoline
From Reuters, "U.S. corn-based ethanol worse for the climate than gasoline, study finds" By Leah Douglas, February 14, 2022, 5:12 PM EST, Last Updated 2 months ago:
Ethanol
Ethanol is a renewable, domestically produced alcohol fuel made from plant material, such as corn, sugar cane, or grasses. Using ethanol can reduce oil dependence and greenhouse gas (GHG) emissions. Ethanol fuel use in the U.S. has increased dramatically from about 1.7 billion gallons in 2001 to about 12.6 billion in 2020.
E10 and E15
Label required on pumps that dispense E15. Label reads as follows: ATTENTION. E15, up to 15% ethanol. Use only in (1) 2001 and newer passenger vehicles (2) flex-fuel vehicles. Don't use in other vehicles, boats or gasoline-powered equipment. It may cause damage and is prohibited by Federal law. E10 and E15 are blends of ethanol and gasoline. The number after the "E" indicates the percentage of ethanol by volume.
Most of the gasoline sold in the U.S. contains up to 10% ethanol—the amount varies by region. All automakers approve blends up to E10 in their gasoline vehicles.
As of 2011, EPA began allowing the use of E15 in model year 2001 and newer gasoline vehicles. Pumps dispensing E15 must be labeled (see example). A vehicle's owner manual may indicate the maximum ethanol content recommended for it by the automaker.
Ethanol contains about one-third less energy than gasoline. So, vehicles will typically go 3% to 4% fewer miles per gallon on E10 and 4% to 5% fewer on E15 than on 100% gasoline.
[Footnotes omitted.] [Emphasis added.]
Recent Study Finds Ethanol More Cartbon Intensive Than Plain Gasoline
From Reuters, "U.S. corn-based ethanol worse for the climate than gasoline, study finds" By Leah Douglas, February 14, 2022, 5:12 PM EST, Last Updated 2 months ago:
Feb 14 (Reuters) - Corn-based ethanol, which for years has been mixed in huge quantities into gasoline sold at U.S. pumps, is likely a much bigger contributor to global warming than straight gasoline, according to a study published Monday.
The study [Environmental outcomes of the US Renewable Fuel Standard], published in the Proceedings of the National Academy of Sciences, contradicts previous research commissioned by the U.S. Department of Agriculture (USDA) showing ethanol and other biofuels to be relatively green.*** “Corn ethanol is not a climate-friendly fuel,” said Dr. Tyler Lark, assistant scientist at University of Wisconsin-Madison Center for Sustainability and the Global Environment and lead author of the study.
The research, which was funded in part by the National Wildlife Federation and U.S. Department of Energy, found that ethanol is likely at least 24% more carbon-intensive than gasoline due to emissions resulting from land use changes to grow corn, along with processing and combustion.
[Emphasis added.]
Geoff Cooper, president and CEO of the Renewable Fuels Association, the ethanol trade lobby, called the study "completely fictional and erroneous," arguing the authors used "worst-case assumptions [and] cherry-picked data."
Under the U.S. Renewable Fuel Standard (RFS), a law enacted in 2005, the nation's oil refiners are required to mix some 15 billion gallons of corn-based ethanol into the nation's gasoline annually. The policy was intended to reduce emissions, support farmers, and cut U.S. dependence on energy imports.
As a result of the mandate, corn cultivation grew 8.7% and expanded into 6.9 million additional acres of land between 2008 and 2016, the study found. That led to widespread changes in land use, including the tilling of cropland that would otherwise have been retired or enrolled in conservation programs and the planting of existing cropland with more corn, the study found.
Tilling fields releases carbon stored in soil, while other farming activities, like applying nitrogen fertilizers, also produce emissions.
A 2019 study from the USDA, which has been broadly cited by the biofuel industry, found that ethanol’s carbon intensity was 39% lower than gasoline, in part because of carbon sequestration associated with planting new cropland.
But that research underestimated the emissions impact of land conversion, Lark said.
Thursday, April 7, 2022
Medicare For All Is Not Really Healthcare For All: Reprint
Reprint of my Wednesday, March 27, 2019, blog post, "Medicare For All Is Not Really Healthcare For All:"
Also see my April 24, 2018, blog post, "Expensive Medicine: My Posted Comment To WSJ Opinion, 'English Literature Isn’t Brain Surgery: Why is American medicine so expensive?' And An Addendum"
A common, widespread misconception among politicians, the media and the public is that the path to cheaper and more available healthcare requires changes to medical insurance, such as Medicare for All or Obamacare.Added March 31, 2019:
Broadening healthcare insurance through subsidies or a government takeover increases demand for medical services without increasing the supply of those services. Excess demand leads to higher prices, limited affordability, and limited availability of health services. Using government subsidies (tax dollars) to lower the visible, consumer payment part of healthcare does not lower the underlying actual cost of medical services and results in continually higher amounts of needed subsidies and higher government budgets (and taxes) to meet the existing and increasing demand for medical care, in part due to a growing and aging population. In the end, the reality will be less medical care availability and not more as originally intended, as government budgets will become insufficient to pay for the needed medical care of the general public.
Medical Insurance Industry
The insurance industry does not provide healthcare and it is not an employer of doctors, nurses, etc. It does not compete in the medical care industry. Medical insurance is a reimbursement mechanism to consumers for their medical costs. It is like collision auto insurance that reimburses a car owner for the repair of damage to a car body, or home fire insurance to pay for repairing fire damage to a house.
No rational person would think that government involvement in collision insurance or fire insurance would lower the purchase price of a car or a home. Yet, with medicine, politicians expect that government involvement in health insurance will lower the cost of seeing a doctor or staying in a hospital. The reality is that the more government is involved in healthcare and healthcare insurance, the more expensive and unavailable it becomes. The private sector, in a profit motive, competitive marketplace, is much better than government in quickly delivering quality goods and services to almost all consumers, while driving costs and prices lower than laws, regulations and government providers can. Government is good at hiding the true cost of consumer services and consumer goods through tax benefits and subsidies, but government is not as good as the competitive marketplace at providing cheaper services through efficiency, productivity and innovation.
For the health insurance industry to continue to exist, the total yearly revenue from health insurance premiums must exceed the total yearly payout to consumers for medical claims. If total insurance premium payments were below total insurance claim payouts, insurance companies would go bankrupt and leave unpaid claims. The way to lower insurance premiums is to lower the total real cost of provided healthcare through healthcare industry competition, efficiency, productivity and innovation.
Healthcare Costs
The problem with healthcare costs is that the medical care industry, not the health insurance industry, is non-competitive and is not striving to increase productivity through innovation and efficiency. The healthcare industry is on the low end of industry productivity improvements in the US, along with education and construction. As long as healthcare productivity is below average and less than the other sectors of the economy, it costs will increase faster than inflation and faster than average growth in income and wealth. The numerous government barriers, medical industry restrictions and anti-competitive behavior to the entry of new doctors, medical providers, trained immigrant doctors, new hospitals and out-patient surgery facilities, limit the number of competitive medical providers and keeps healthcare services prices artificially high.
In the case of government run medical services, when the yearly budget is exceeded or the money runs out, the services and subsidies stop. For Medicare for All to be able to pay the annual medical costs for all eligible individuals, its total annual budget cannot be lower than the total actual yearly medical usage costs of all those covered under Medicare for All. Doctors and hospitals that currently accept the existing Medicare do so because they are cross-subsidized by the higher payments by the individuals (mostly under 65) covered by private insurance and not Medicare. Once Medicare for All goes into effect, those that are paying higher amounts than Medicare will cease to exist and the current existing fee structure of Medicare will have to be higher under Medicare for All.
To control costs and avoid going over its yearly budget, government will have to limit the availability and usage of healthcare services through limiting the availability of technology, doctor appointments and surgeries. Wait times will increase to see doctors, to have medical tests and surgery performed. Purchase and use of newer and existing technologies will be delayed or not purchased in sufficient numbers to meet demand without excessive delays.
Medicare for All will give you insurance coverage, but it will very quickly result in delays in receiving care, delays in replacing outdated technologies and under-funding in medical infrastructure. The inability to obtain needed quality medical care in a timely manner, is in reality equivalent to having no medical coverage, or at best inferior medical care. Medicare for All will quickly evolve and give you health insurance without access to timely, needed healthcare and without access to the best technology and treatments.
Also see my April 24, 2018, blog post, "Expensive Medicine: My Posted Comment To WSJ Opinion, 'English Literature Isn’t Brain Surgery: Why is American medicine so expensive?' And An Addendum"
Wednesday, April 6, 2022
Price Controls Are Costly And Ineffective: St. Louis Fed Article
Excerpt from the Federal Reserve Bank of St. Louis, "Why Price Controls Should Stay in the History Books" by Christopher J Neely, March 24, 2022:
This article reexamines price controls, discussing their history, operation and disadvantages, and economists’ views on the policy. It explains why most economists believe broad price controls to be costly and ineffective in most situations.*** Price controls are government regulations on wages or prices or their rates of change. Governments can impose such regulations on a broad range of goods and services or, more commonly, on a market for a single good. Governments can either control the rise of prices with price ceilings, such as rent controls, or put a floor under prices with policies such as the minimum wage.*** The History of Price Controls*** The U.S. government last used broad controls in a series of schemes from 1971-74 following the withdrawal of the dollar from the gold standard. Many developing countries control the prices of staples, sometimes combining price controls with subsidies.
The Impact of Price Controls
Let’s consider the impact of price ceilings. High prices have two economic functions:That is, prices allocate scarce resources on both the consumption and production sides. Price controls distort those signals.
- They allocate scarce goods and services to buyers who are most willing and able to pay for them.
- They signal that a good is valued and that producers can profit by increasing the quantity supplied.
*** Costs of Price Controls
Price controls have costs whose severity depends on the broadness of the control and the degree to which it changes the price from the free-market price. The costs include the following:
- A government bureaucracy and law enforcement must be funded to enforce the controls.
- Goods and services are allocated inefficiently, both in consumption and production.
- Competition shifts from production to political markets as firms attempt to influence price-setting decisions.
- Widespread evasion of price controls promotes disrespect for the law.
- Suppressed inflation appears when temporary controls are relaxed.
*** How Do People and Firms Evade Wage and Price Controls?
When a price ceiling prohibits a desired transaction, the buyer and seller will often evade the price ceiling by transacting in a closely related but unregulated product or by trading illegally in black markets. Similarly, sellers might change a good slightly to prevent it from being subject to the same price limit. The economist Hugh Rockoff notes that the price of clothing has been particularly difficult to control because an article of clothing can be upgraded easily to a higher-priced category by adding inexpensive decoration or reduced in quality by substituting cheaper materials.
The historian Jennifer Klein has documented that the current dependence of the U.S. health care system on employer-provided insurance is a relic of the evasion of wage controls during World War II. During that conflict, defense industries wanted to hire more workers but could not legally raise wages. To make their jobs more attractive, some employers began offering health insurance as a legal fringe benefit.
Price controls prompt greater behavioral changes in the long run. Consider how firms might respond to a higher minimum wage that increases the cost of entry-level labor. In the short run, employers might raise prices and economize on labor. Firms will tend to raise prices, even in a competitive market, because producers must pay higher wages to their employees. People will consume less of the higher-priced products that use entry-level labor intensively. In the longer run, employers will install more capable machines, such as dishwashers or automated cooking machines, to reduce the quantity of entry-level labor they use.
What Do Economists Think about Price Controls?
Economists generally oppose most price controls, believing that they produce costly shortages and gluts. The Chicago Booth School regularly surveys prominent economists on questions of interest, including price controls. Most economists do not believe that 1970s-style price controls could successfully limit U.S. inflation over a 12-month horizon, and many of those economists cite high costs of controls.*** Conclusion
Price controls have had a very long but not very successful history. Although economists accept that there are certain limited circumstances in which price controls can improve outcomes, economic theory and analysis of history show that broad price controls would be costly and of limited effectiveness. Appropriate fiscal and monetary policies can reduce inflation without the costs imposed by price controls.
[Footnotes and Charts Omitted.]
Monday, March 28, 2022
My Comment To WSJ Opinion, "Prepare Now to Repeal ObamaCare Later"
My published comment to The Wall Street Journal, Opinion, "Prepare Now to Repeal ObamaCare Later: Republicans need to show voters they have a viable alternative" by Bobby Jindal, March 27, 2022:
Too much government focus on the affordability and demand/user side of medical care and too little focus on the cost and supply/medical providers side of medical care. Medical care is non-competitive, has below US average, productivity growth and limited entry of new medical providers, which has led to higher medical price increases than wage growth and inflation since before WWII. The Association of American Medical Colleges and the American Medical Association limit the number of US medical training facilities, medical schools and hospital residency slots. Current medical licensing requirement of 4 years of college, 4 years of medical school, and several years of hospital residency could be reduced, but prior approval is needed. Numerous states limited the opening of new hospitals unless the new entrant can show an unmet need, which does not include consideration of competitive/lower pricing. A greater supply of medical providers in a competitive environment would lower prices and improve quality better and faster than any government program.
Thursday, March 24, 2022
Myths About US Welfare And Reasonable Solutions To US Healthcare Costs: Informative And Interesting 23 Minute Podcast
From City Journal, 10 Blocks Podcast, "Puncturing Myths about the U.S. Welfare State" by Chris Pope and Brian C Anderson, March 23, 2022:
Wednesday, March 23, 2022
US Gasoline Prices Adjusted For Inflation And Fuel Economy, 1976 - March 2022
From The Wall Street Journal, Economy, "Gas Prices Shoot Up at Fastest Rate on Record: Prices for gasoline have soared across the U.S., but filling up isn’t so pricey historically after taking inflation and fuel-economy improvements into account" by Kara Dapena:
These elevated gas prices sting a little less than they did in the early ’80s, when inflation-adjusted prices were similar, because vehicles have become more fuel efficient. In 1980, new passenger vehicles got an average estimated 19 miles to the gallon, according to the Environmental Protection Agency. New vehicles today get about 25 miles to the gallon.
So, while gas prices in 1980 and in March of this year are similar after adjusting for inflation, drivers need 25% less gas to travel the same distance today as was needed then.
 |
| Source: The Wall Street Journal |
Saturday, February 19, 2022
Does The Federal Reserve Have The Best Information? A 2008 And 2011 Reprint
The following is a still relevant reprint of one of my blog posts from 2008 that I also reprinted in 2011:
Monday, January 24, 2011
The following post is a reprint of my January 4, 2008, post on another, short-lived blog of mine. I am reprinting the post because 3 years later there is still a need for solutions to our economic problems of slow GDP growth and high unemployment and there is still an ongoing debate as to what are the best monetary and fiscal action policies to follow:
January 4, 2008
Does the Fed have the right information?
Does the Federal Reserve have the best information to control inflation and maintain employment growth? Has the Fed been too passive in accepting the current supply of economic data?
The Fed, like the rest of us, relies on published economic data, surveys, and anecdotal evidence to assess the state of the economy, and most of that data reflects past or concurrent [coincident] economic indicators of the health of the economy. The Fed does not have magical powers or a crystal ball to tell it what will happen next. The Fed does not have a secret recipe that makes it a better predictor of the future of the US economy than ordinary investors. But, the Fed does attempt to maintain a sustainable level of economic growth that will cause neither inflation nor excessive unemployment based on all available information.
In fact, the Fed and many economists look at bond yields, including the slope of the yield curve, and stock market prices to assess future GDP because these prices contain investor expectation data about future interest rates, inflation, and economic growth.
But is the Fed too passive in monitoring the current supply of information. Why doesn't the Fed in conjunction with the Treasury create a government issued financial instrument that would reveal more about the future of the US economy than is currently available?
For example, Treasury could issue a GDP linked bond whose semiannual coupon payment would be a fixed percentage of the most recent nominal GDP number at the time of coupon payment. This would force investors, in pricing the bond, to incorporate explicit expectations about future GDP. The price of the bond would reflect the present value of all future GDP growth over the period until maturity. And because the bond would be discounted (present valued) based on nominal interest rates, the current price would be a measure of total real (inflation adjusted) GDP over the life of the bond.
GDP linked treasury bonds, through analysis of embedded forward rates, would allow the Fed to see in what future time periods over the future life of the bonds that the market was predicting a slow down in economic growth. It would also allow the Fed to see if its policies were merely time shifting future economic growth into other periods without actually creating any overall growth in the economy.
Over time, the premium on the rates paid on these bonds over plain treasury bonds would allow for an analysis of the inherent risk of the US economy. And whether this risk changes over time.
Changes in the price and future embedded rates of GDP linked bonds would allow for an analysis of the effect of legislative and other governmental policies on US future economic growth. If the government introduces or discusses policies and there is an immediate decrease in the price of the bonds then clearly the policies are not good for maximizing future economic growth; although, they may have other benefits.
Having a GDP linked treasury bond would allow the US to maximize future economic growth. The bonds would also allow information about future economic activity to be discerned and assigned to a specific future time period. GDP linked bonds would allow the populace to see if our politicians are doing positive things for the future health of the US economy after their terms in office end before we actually are in those time periods.
The Fed does have very good mathematical economic models to project future economic growth. However, like all models, they work only as long as the relationship among the variables remains static or predictable. So for example, one of the Fed's models mistakenly predicted that we should have been in a recession for the last several years because it used historical relationships about the relative investment in fixed capital versus intellectual property and missed the increase investment in intellectual assets. When correcting the model for the actual relationship between intellectual and fixed property investments over the last several years, the model accurately predicted the actual historical economic growth, but failed on a prospective basis because of the change in the relationship of the variables.
The Fed should take a more active role in deciding what information it can obtain from the investment markets, design instruments accordingly, and work with Treasury in issuing and creating liquid markets for these information designed securities.
Wednesday, January 26, 2022
Accuracy Of CBO's Budget Projections For Fiscal Year 2021: Revenue Projections Were 15 Percent Too Low: Outlay (Expense) Projections Were 4 Percent Too High
From CBO, "The Accuracy of CBO’s Budget Projections for Fiscal Year 2021:"
Largely because of the uncertainties associated with the pandemic and the implementation of substantial legislation, some of CBO’s projections for 2021 differed from the actual results by much larger amounts than usual. Taking all adjustments into account, the overall differences were as follows (see Table 1):
- Revenues. CBO’s projection of $3.43 trillion for federal revenues in 2021 was too low—by $614 billion, or 15 percent. That difference was three times the mean absolute error of about 5 percent in revenue projections made for the years from 1983 to 2020.5
- Outlays. CBO’s projection of $7.07 trillion for federal outlays in 2021 was too high—by $250 billion, or 4 percent. That difference of 4 percent was larger than the mean absolute error of 2 percent in outlay projections made for the years from 1993 to 2020.
- Deficit. The differences in revenue and outlay projections resulted in a deficit projection for 2021 that was $864 billion more than the actual amount: $3.64 trillion rather than $2.78 trillion.6 That difference was equal to 3.9 percent of gross domestic product (GDP). By comparison, the mean absolute error in deficit projections reported for 1985 to 2020 equaled 1.0 percent of GDP.
The three categories with the largest misestimates accounted for $789 billion of the deficit difference: individual income taxes, Medicare outlays, and corporate income taxes. By far the largest difference stemmed from an underestimate of receipts from individual income taxes.
Table 1.
CBO’s Budget Projections for 2021, Compared With Actual Outcomes
Billions of Dollars
Data sources: Congressional Budget Office; Department of the Treasury. See www.cbo.gov/publication/57614#data.
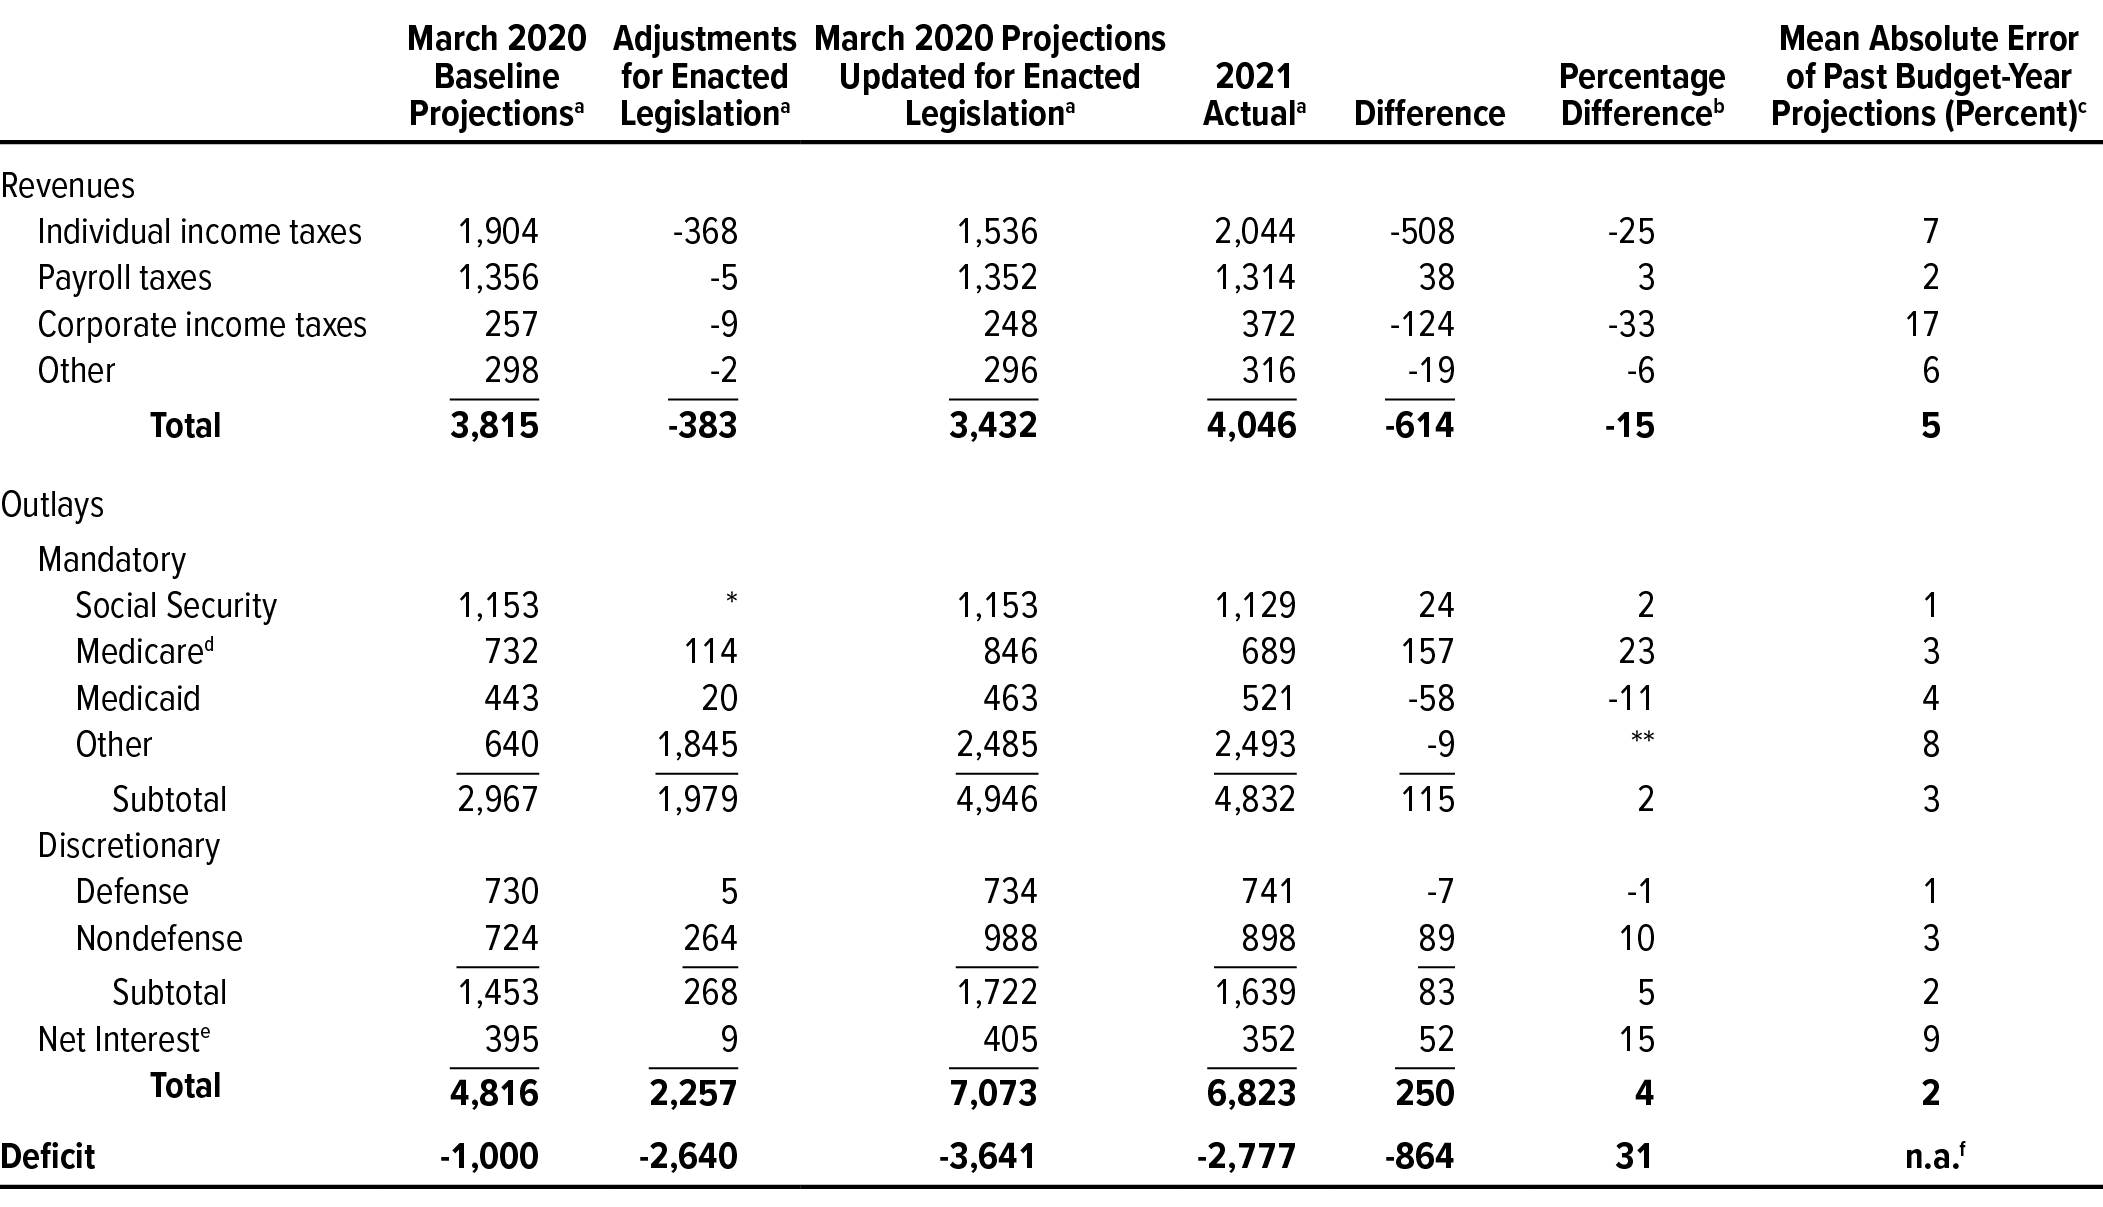
Subscribe to:
Posts (Atom)