 |
| Source; The Wall Street Journal |
Saturday, January 31, 2015
Small Business Source Of Financing Table
From The Wall Street Journal, "How to Start a Business With Very Little Money: The Trick: Finance the Startup With Your Customers’ Cash—Instead of Loans or Investments" by John Mullins:
Monday, January 26, 2015
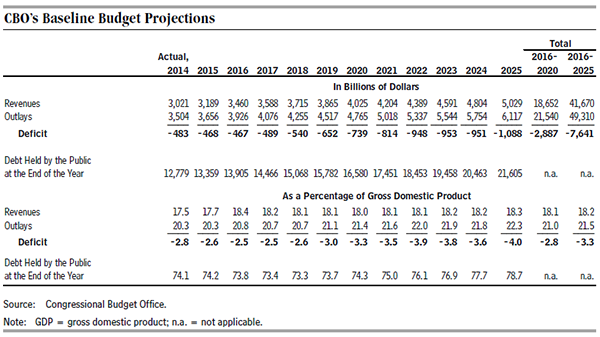
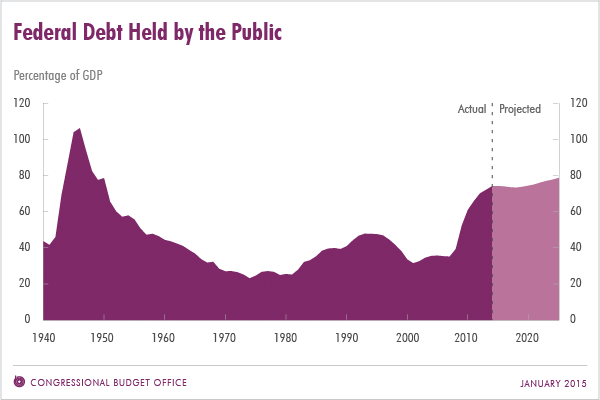
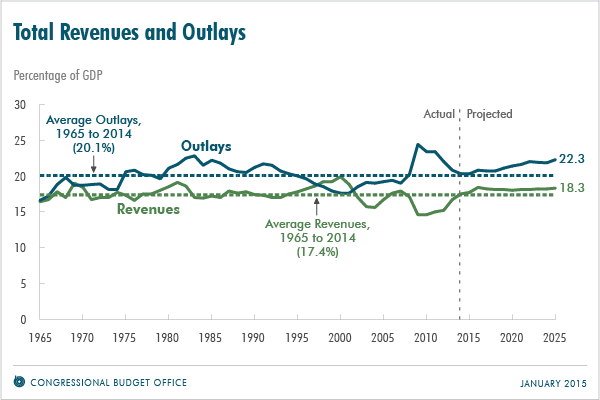
CBO Slide Presentation On US Economic Outlook For 2015 To 2025
From Congressional Budget Office, "The Economic Outlook for 2015 to 2025 in 17 Slides" presentation:
From Congressional Budget Office, "The Budget and Economic Outlook: 2015 to 2025" report:
***
***
From Congressional Budget Office, "The Budget and Economic Outlook: 2015 to 2025" report:
 |
| Source: CBO |
 |
| Source: CBO |
 |
| Source: CBO |
Friday, January 23, 2015
Low Income Boys Living In Economically Mixed Communities Engage In More Antisocial Behavior
From ScienceBlog, "Low-income boys fare worse in wealth’s shadow:"
Low-income boys fare worse, not better, when they grow up alongside more affluent neighbors, according to new findings from Duke University. In fact, the greater the economic gap between the boys and their neighbors, the worse the effects, says the new article based on 12 years of research.The study, "Living alongside more affluent neighbors predicts greater involvement in antisocial behavior among low-income boys" by Candice L Odgers, Sachiko Donley, Avshalom Caspi, Christopher J Bates and Terrie E. Moffitt published online, Jan 22, 2015, in the Journal of Child Psychology and Psychiatry: http://onlinelibrary.wiley.com/doi/10.1111/jcpp.12380/abstract.
"Our hope was that we would find economically mixed communities that allowed low-income children access to greater resources and the opportunity to thrive," said Candice Odgers, associate director of the Duke Center for Child and Family Policy. "Instead, we found what appears to be the opposite effect."*** The authors found that in economically mixed settings, low-income boys engaged in more antisocial behavior, including delinquent behavior such as lying, cheating and swearing, and aggressive behavior such as fighting.*** Among the low-income boys, those living in neighborhoods classified as "hard-pressed," where 75 percent or more of the local area was poor, had the lowest rates of antisocial behavior. Poor boys’ behavior was worse in middle-income neighborhoods, and worse still in the wealthiest neighborhoods studied, said Odgers, a psychologist who is an associate professor at Duke’s Sanford School of Public Policy. She said the findings held true from ages 5 through 12.
Total Value Of Home Sales To Foreigners Rose 35 Percent Last Year
From BloombergView, "Nothing Is Going to Save the Housing Market" by A Gary Shilling:
U.S. housing activity remains weak despite six years of federal government aid, strong interest from overseas buyers, rock-bottom interest rates and massive purchases of mortgage bonds by the Federal Reserve.*** Don't blame the Chinese, who are showing an abundance of interest. Their share of foreign purchases leaped to 16 percent in the year ending March 2014, from 5 percent in 2007. They paid a median price of $523,148, higher than any other nationality and more than double the $199,575 median price of all houses sold.
The value of home sales to all foreigners rose 35 percent last year to $92 billion, up more than 50 percent since 2007 and accounting for 7 percent of all existing home sales. Foreigners view U.S. homes as safe investments and U.S. schools as good places to teach their children English.
Tuesday, January 20, 2015
US Individual Income Inequality Has Not Changed For The Last 50 Years: Family And Household Income Inequality Increased Due To Social Factors (Increasing Divorce, Later Marriage, Single Parenthood, Assortative Mating) And Not Due To Unequal Income Gains
From TownHall.Com, Political Calculations, "The Major Trends in U.S. Income Inequality Since 1947:"
Modified weblink to quoted article from TownHall to Poltical Calculations website.
UPDATED
Source: TownHall.Com
In the chart above, we see that the amount of income inequality among individual Americans increased in the years from 1947 to 1960. This corresponds to the period of time following the end of World War 2's wage and price controls on 9 November 1946, which had prevented Americans from being able to earn incomes that matched the value of their true level of productivity.
*** After 1960 however, the post-war income adjustments reached their natural limits and the level of income inequality among U.S. individuals stabilized. The Gini coefficient for U.S. individuals has been essentially flat ever since, falling within a very narrow range.
That observation is significant because if income inequality in the United States was really rising as a result of economic factors that concentrate an increasing amount of income into progressively fewer hands, we would not observe this outcome because income payments are made to individuals, not to households and not to families.*** We do however observe such a rising trend in measured income inequality in the Gini coefficients calculated for U.S. households and for U.S. families. Interestingly, we don't see much of that change occurring when economic factors were actually driving up the level of income inequality among individual American income earners in the years from 1947 through 1960. Instead, we see that the overall trend for household and family inequality was basically flat during this time, which then continued through the 1960s. It's not until 1970 that we find that a rising trend in the amount of income inequality for U.S. households and families begin to take hold.
From 1970 through 1992, we see that the amount of income inequality among U.S. households and families increases steadily - and since we don't observe a similar trend among individuals, we must conclude that social factors, such as the changing composition of the nation's families and households over time, are the primary cause of that trend.

Modified weblink to quoted article from TownHall to Poltical Calculations website.
Tuesday, January 13, 2015
Growing Inequality Between Post Graduates And College Degree Holders: Wage Gap Between Post Graduate Degree And College Degree Growing
From Federal Reserve Bank Of San Francisco, Economic Letter, "Higher Education, Wages, and Polarization" by Rob Valletta:
Holding a four-year college degree gives a worker a distinct advantage in the US labor market. The wage gap between college-educated working adults and those with high school degrees is large and has grown steadily over the past 35 years. This gap appears to be bolstered by technological advances in the workplace, notably the ever-growing reliance on computers, because the skills needed to apply these technologies are often acquired through or associated with higher education. Since 2000, however, this trend has altered. Increasingly, the US labor market favors workers who hold a graduate degree, while the wage advantage for those who hold a four-year college degree has changed little.
 |
| Source: Federal Reserve Bank Of San Francisco |
Note: Author’s estimates from Current Population Survey data (outgoing rotation groups), ages 25–64. Top-code adjusted; observations with imputed earnings/hours dropped.
Saturday, January 10, 2015
2014 Bank Secrecy Act/ Anti-Money Laundering Examination Manual
From "The 2014 Version of the Bank Secrecy Act/Anti-Money Laundering Examination Manual" by Board of Governors of the Federal Reserve System, Federal Deposit Insurance Corporation, National Credit Union Administration, Office of the Comptroller of the Currency and State Liaison Committee:
Bank Secrecy Act Anti-Money Laundering Examination Manual 2014
Friday, January 9, 2015
US Has Fewest Number Of Taxable Corporations (C Corporations) Since 1974
From Tax Foundation, "America’s Shrinking Corporate Sector" by William McBride:
Recently released IRS data shows that there were 1.6 million C corporations in 2011. This is the lowest number of traditional corporations since 1974 and 1 million fewer than there were at the peak in 1986. In other words, in every year since 1986, roughly 40,000 U.S. corporations have disappeared from the tax rolls. However, the losses have accelerated since 2006 to a rate of about 60,000 per year. (See Figure 1.)
Source: Tax Foundation
Corporate inversions, of which there were only fourteen in 2014, can explain only a tiny number of these losses. As Figure 1 shows, the decline of the traditional corporate sector has generally coincided with the rise of the pass-through sector, comprised of businesses such as partnerships and S corporations that pass profits to owners who report them on their individual tax returns. Pass-through businesses are subject to just one layer of tax, the individual income tax, while C corporations face double taxation due to the corporate tax and shareholder taxes on dividends and capital gains.
Pass-through businesses have grown dramatically since 1986 such that more than 90 percent of U.S. businesses are now pass-through entities. [Footnotes omitted.]

Wednesday, January 7, 2015
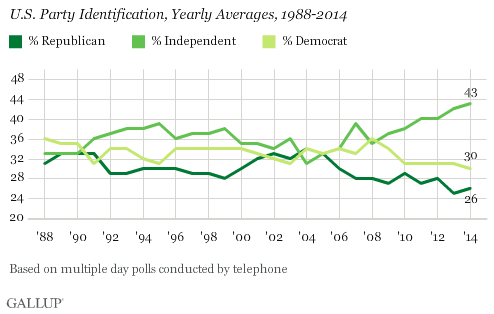
In 2014, 43 Percent Of Americans Politically Identify As Independents: 30 Percent As Democrats: 26 Percent As Republicans: Gallup Surveys
From Gallup, "In US, New Record 43% Are Political Independents" by Jeffrey M Jones:
An average 43% of Americans identified politically as independents in 2014, establishing a new high in Gallup telephone poll trends back to 1988. In terms of national identification with the two major parties, Democrats continued to hold a modest edge over Republicans, 30% to 26%.
Source: Gallup
Since 2008, the percentage of political independents -- those who identify as such before their leanings to the two major parties are taken into account -- has steadily climbed from 35% to the current 43%, exceeding 40% each of the last four years. Prior to 2011, the high in independent identification was 39% in 1995 and 1999.
The recent rise in political independence has come at the expense of both parties, but more among Democrats than among Republicans. Over the last six years, Democratic identification has fallen from 36% -- the highest in the last 25 years -- to 30%. Meanwhile, Republican identification is down from 28% in 2008 to 26% last year.
Tuesday, January 6, 2015
China, The Major Producer Of Rare-Earths, Cannot Control Prices And Supply Of Rare Earth Elements: Market And Economic Forces Win As Usual
From The Wall Street Journal, Review and Outlook, "Rare-Earths Resistance: China stages a mercantilist retreat, at least for now."
As recently as 2010 China produced 95% of the world’s rare earths, partly because it has rich deposits and partly because it’s willing to tolerate the pollution that is a byproduct of mining the stuff. That same year Beijing tightened export quotas by 40% in an attempt to coerce technology companies to transfer production, and hence intellectual property, to its shores. It also briefly cut off shipments to Japan in retaliation for a territorial dispute.
But the power play backfired. After a brief spike, global prices for neodymium, dysprosium and other rare-earth elements fell to normal levels. Mining companies expanded operations in other countries. Recyclers stepped up the recovery of rare earths from discarded products. Technological innovation allowed manufacturers to find substitutes for the minerals. Chinese smugglers exported the minerals illegally.
Such are the universal responses to a cartel: conserve, substitute—and cheat.
Friday, January 2, 2015
Share Of Under 30 Year Olds Owning A Private Business At 24-Year Low
From The Wall Street Journal, "Endangered Species: Young U.S. Entrepreneurs: New Data Underscore Financial Challenges and Low Tolerance for Risk Among Young Americans" by Ruth Simon and Caelainn Barr:
The share of people under age 30 who own private businesses has reached a 24-year-low, according to new data, underscoring financial challenges and a low tolerance for risk among young Americans.
Roughly 3.6% of households headed by adults younger than 30 owned stakes in private companies, according to an analysis by The Wall Street Journal of recently released Federal Reserve data from 2013. That compares with 10.6% in 1989—when the central bank began collecting standard data on Americans’ incomes and net worth—and 6.1% in 2010.
 |
| Source: The Wall Street Journal |
Subscribe to:
Posts (Atom)