If Trump does well as the President of the US, every item, hotel and rental property with or associated with the Trump name will increase in status and also will be more valuable. If he does poorly as the US President, every Trump item and property will be less valuable. He is probably the only US president who has ever had the equivalent of an equity stake in the success of his presidency, the future of the US economy and the global success of US foreign policy. He is probably the only US president who while in office has monetary incentives to do the right thing for the US. Unless Trump is promising to a foreign country some specific US governmental benefit, such as foreign aid, US military support, easier immigration to the US, ignoring human rights violations, etc., in return for a Trump Inc benefit, there is no conflict in continuing his Trump holdings. Unless Trump is following or recommending policies that solely benefit Trump holdings there are no conflict of interests.
Friday, November 25, 2016
My Unconventional Comment To Peggy Noonan's Opinion Piece On Trump's Conflict of Interests In The Wall Street Journal
My unconventional comment to The Wall Street Journal, Opinion, "No More Business as Usual, Mr. Trump: He has to abandon his company in order to deal on the country’s behalf." by Peggy Noonan:

Wednesday, November 23, 2016
Who In The US Has Not Read A Book In The Past 12 Months?
From Pew Research Center, "Who doesn’t read books in America?" by Andrew Perrin:
About a quarter of American adults (26%) say they haven’t read a book in whole or in part in the past year, whether in print, electronic or audio form. So who, exactly, are these non-book readers?
Source: Pew Research Center

Friday, November 18, 2016
Sources Of US Energy And Life-Cycle Green-House Gas Emissions Chart
From The Wall Street Journal, Journal Reports: Energy, "Is Nuclear Power Vital to Hitting CO2 Emissions Targets? Supporters say nuclear plants are the best way to transition to a low-carbon future. Others argue the plants are too risky to keep in operation:"
 |
| Source: The Wall Street Journal |
Thursday, November 10, 2016
Job Growth From New Firms At Lowest Level In Over 20 Years
From The Wall Street Journal, Real Time Economics, "Job Gains at Startups Are Way Down and That’s a Bad Sign: Job gains from new firms are at the lowest share of employment since 1992" by Anna Louie Sussman:
Job gains from new firms are at the lowest share of employment in over 20 years, another sign of the declining role entrepreneurship plays in the U.S. economy.
Job gains from opening establishments as a percentage of overall private-sector employment dropped to 1% in the first quarter of 2016, the lowest level recorded since the Labor Department began the data series in 1992, and half what it was at its peak.
Throughout the 1990s, the share hovered between 1.6% and 2%, and edged lower throughout the subsequent decade. Since 2009, when the economic recovery began, it held between 1.1% and 1.3%.***
Source: The Wall Street Journal

Monday, November 7, 2016
Trump Has 20 To 30 Percent Chance Of Winning The Presidency According To Online Betting Markets
As of 5 PM EST, November 7, 2016, Donald Trump has between a 20 and 30 percent chance of winning the US Presidential election, according to several online political betting sites.
The University Of Iowa's online political betting market, Iowa Electronic Markets, gives Donald Trump a 22.6 percent chance of winning the US presidential election.
The online Ireland company political betting site, Predictious, shows Trump's chances of winning between 27.4 percent and 29.9 percent (bid ask prices).
The online betting site, PaddyPower, has Trump's odds as winning as 10 to 3, which is equivalent to 23.1 percent chance of winning.
The University Of Iowa's online political betting market, Iowa Electronic Markets, gives Donald Trump a 22.6 percent chance of winning the US presidential election.
The online Ireland company political betting site, Predictious, shows Trump's chances of winning between 27.4 percent and 29.9 percent (bid ask prices).
The online betting site, PaddyPower, has Trump's odds as winning as 10 to 3, which is equivalent to 23.1 percent chance of winning.
Wednesday, November 2, 2016
Worldwide Mobile Web Browsing Has Surpassed Desktop Browsing: US Desktop Web Browsing Still Leads Over Mobile
From alphr, "Mobile browsing just overtook the desktop for the first time: The decline of the desktop just passed a major milestone" by Alan Martin:

October 2016 was the month smartphones and tablet web browsing finally took the [worldwide] lead [over desktops]: 51.3% to 48.7%.
***
 |
| Source: alphr |
Monday, October 31, 2016
Highest Rent Metropolitan Areas For Low And Average Quality Apartments: Units That Are Old And Needing Renovation: Chart
From Bloomberg, "Two New Charts Prove San Francisco Rents Are Out of Control: It's getting even more expensive to live in the Bay Area." by Patrick Clark:
CoStar Group, a real estate data firm, uses a five-star system to rate multifamily properties based on architectural attributes, structural systems, amenities, and other traits. For instance, one star buildings require significant renovation or are functionally obsolete. Two star buildings are associated with phrases like “functional,” average,” and “aging.” Together, one- and two-star buildings account for roughly one-third of market rate multi-family units in the U.S. There are plenty of big cities, like Dallas, or Atlanta, where the average asking rents for such apartments are less than $800 a month.
In San Francisco, typical monthly rent for the metropolitan area’s most humble housing stock is more than three times that amount—a staggering $2,586.
Source: Bloomberg

Thursday, October 27, 2016
Social Security Funding Problem In 3 Pictures From BloombergPolitics
From BloombergPolitics, "How the Next President Could Save Social Security" by Dave Merrill and Chloe Whiteaker:
The problem
Since 2010, Social Security’s funding mechanism has been taking on water. The number of workers supporting a growing number of retiring baby boomers is not sufficient to pay all the benefits they are due.
Source: BloombergPolitics
‘Trust fund’ draw down
Since there are not enough payroll taxes being collected day-to-day, money is drawn from Social Security’s “trust fund” reserve to meet the shortfall. The $2.8 trillion reserve grew out of payroll tax increases initiated in 1984.
Source: BloombergPolitics
Reserve depletion, 2034
When the trust fund reserves are depleted in 2034, retirees will collect only what the workers’ payroll taxes can provide: about 79 percent of benefits. So, for example, instead of an annual $18,000 benefit, a retiree would receive $14,220.
Source: BloombergPolitics


Wednesday, October 26, 2016
74 Percent Of Voters Want Congressional Term Limits
From Rasmussen Reports, "More Voters Than Ever Want Term Limits for Congress:"
Voters agree more strongly than ever with the need for term limits but also still doubt Congress will go along with them.
A new Rasmussen Reports national telephone survey finds that 74% of Likely U.S. Voters favor establishing term limits for all members of Congress. Just 13% are opposed, while just as many (13%) are undecided.
Sunday, October 23, 2016
Iran, Not Russia, Hacked Democratic National Committee (DNC), Says John McAfee
From CYBERSECURITY BUSINESS REPORT, "John McAfee: 'Iran hacked the DNC, and North Korea hacked DYN' " by Steve Morgan:
John McAfee -- in an email exchange and follow up phone call just moments ago -- said sources within the Dark Web suggest it was Iran, and he absolutely agrees. While Russian hackers get more media attention nowadays, Iranian hackers have had their share.*** Earlier this year, Iranian hackers were charged by the U.S. Department of Justice (DOJ) over cyber attacks.*** What about Russia?
"If all evidence points to the Russians, then, with 100% certainty, it is not the Russians," said McAfee. "Anyone who is capable of carrying out a hack of such sophistication is also capable, with far less effort than that involved in the hack, of hiding their tracks or making it appear that the hack came from some other quarter. The forensic tools used to assign culpability in a hack are well known, in the cybersecurity world, to be largely ineffective. They may, sometimes, correctly identify an unsophisticated 15 year old as the source of a hack, such as the teenager who hacked the FBI less than a year ago. But they are completely ineffective against large, sophisticated groups of hackers such as those run by the Russian State."
Friday, October 21, 2016
Bank Fines Causing Slow Global Growth: Fines Reduced Global Lending Capacity To Real Economy By Over $5 Trillion
From The Wall Street Journal, "Bank Legal Costs Cited as Drag on Economic Growth: Fines on banks translate into $5 trillion of ‘reduced lending capacity,’ bank says" by Katy Burne and Aruna Viswanatha:
A heightened emphasis by banking regulators and law-enforcement officials on financial misconduct may be constraining global growth, some officials warn.
Legal expenses are among the burdens weighing on banks, policy makers say. “The roughly $275 billion in legal costs for global banks since 2008 translates into more than $5 trillion of reduced lending capacity to the real economy,” Minouche Shafik, a deputy governor of the Bank of England, told a New York conference of regulators and bankers Thursday.
Other policy makers have expressed concern that strict crackdowns on banks’ lapses in carrying out anti-money-laundering regulations have led banks to nearly cut off several emerging markets from the global financial system, damping their economies. The International Monetary Fund, in particular, has sounded that alarm repeatedly this year and held a conference highlighting the issue at its annual meeting in early October.
Thursday, October 13, 2016
Hillary's Tax Plan Will Lower GDP, Capital Investment, Jobs, Wages: Hillary's Tax Plan Will Lower Payroll Tax Revenue That Funds Social Security And Medicare
From Tax Foundation, "Details and Analysis of Hillary Clinton’s Tax Proposals, October 2016" by Kyle Pomerleau:
Economic ImpactPayroll taxes are used to fund Social Security and Medicare. Hillary's tax plan, through lower wages and fewer full-time equivalent jobs, will lower tax revenues to fund these two programs. Her plan will exacerbate the funding problem that Medicare and Social Security already have.
According to the Tax Foundation’s Taxes and Growth Model, Secretary Clinton’s tax plan would reduce the economy’s size by 2.6 percent in the long run (Table 2). The slightly smaller economy would lead to 2.1 percent lower wages, a 6.9 percent smaller capital stock, and 697,000 fewer full-time equivalent jobs. The smaller economy results from somewhat higher marginal tax rates on capital and labor income.
These projections are what we estimate would happen at the end of a ten-year period and are compared to the underlying baseline of what would occur absent any policy change. For example, the U.S. real GDP will grow by 19.2% from 2016-2025, according to the Congressional Budget Office (CBO), if policy remains unchanged. We predict that the reduced incentives to work, save, and invest would reduce the end-of-period GDP by 2.6 percent below the level it would have been without the policy change.
Revenue Impact*** On a dynamic basis, the plan would increase federal revenues by $663 billion over the next decade. The slightly smaller economy would reduce wages, which would narrow both the individual income and payroll tax bases. As a result, the individual income tax proposals would raise less than half as much revenue as they do under the static analysis, while payroll tax revenues would decline.
Wednesday, October 12, 2016
Hillary's Higher Income Tax Rate On The Very Rich Will Not increase Tax Revenues
"High Tax Rates Don’t Raise Receipts" from The Heritage Foundation, Federal Budget in Pictures:
High Tax Rates Don’t Raise Receipts
 |
| Source: Heritage Foundation |
Tuesday, October 4, 2016
US Supreme Court Has Upheld Right Of Any Taxpayer To Decrease Or Avoid Taxes Altogether: Trump Is Just Doing What The US Supreme Court Has Said Is Legal For The Past 80 Years
From Justia, US Supreme Court, Gregory v. Helvering, 293 US 465 (1935):
The legal right of a taxpayer to decrease the amount of what otherwise would be his taxes, or altogether avoid them, by means which the law permits, cannot be doubted. United States v. Isham, 17 Wall. 496, 84 U. S. 506; Superior Oil Co. v. Mississippi, 280 U. S. 390, 280 U. S. 395-396; Jones v. Helvering, 63 App.D.C. 204, 71 F.2d 214, 217.As the most quoted lower court federal judge, Judge Learned Hand stated in the same case at the lower level federal appellate court, Helvering v. Gregory, 69 F.2d 809, 810 (2d Cir. 1934), aff'd, 293 U.S. 465 (1935):
Any one may so arrange his affairs that his taxes shall be as low as possible; he is not bound to choose that pattern which will best pay the Treasury; there is not even a patriotic duty to increase one's taxes. U. S. v. Isham, 17 Wall. 496, 506, 21 L. Ed. 728; Bullen v. Wisconsin, 240 U.S. 625, 630, 36 S. Ct. 473, 60 L. Ed. 830. Therefore, if what was done here, was what was intended by section 112 (i) (1) (B), it is of no consequence that it was all an elaborate scheme to get rid of income taxes, as it certainly was.
Saturday, September 17, 2016
Illinois Pension Switches From Active Managed To Passive Index Funds: Fees Drop 90 Percent
From The Wall Street Journal, "Illinois State Pension Board Stops Trying to Beat the Market: Switch to funds that track market is a win for Vanguard Group, Northern Trust; among the losers: T. Rowe Price, Fidelity" by Timothy W Martin:
The board overseeing 401(k)-style benefits for 52,000 Illinois state workers has terminated all money managers who try to handpick winners, a major embrace of low-cost funds that instead mimic the markets.*** The shift would dramatically reduce outside management fees paid plan-wide, dropping from more than $10 million annually to $1 million, Marc Levine, the board’s chairman, said in an interview. On a per-participant basis, it equates to fees being shaved to about one-fourth of the previously paid total.*** The Illinois plan’s abandonment of higher-charging, so-called “active” managers comes amid a broader debate unfolding among big investors: whether Wall Street firms can consistently outperform a simple index fund that costs virtually nothing.
Tuesday, September 13, 2016
My Posted Comment To Megan McArdle's Bloomberg Article, "Banks and Colleges Are Wasting Our Money"
My posted comment to Megan McArdle's article, "Banks and Colleges Are Wasting Our Money" on BloombergView:
When there are rents and barriers to entry, innovators attempt, sometimes successfully and sometimes not, to develop less costly and/or higher quality substitute products. We get email, text message, Skype, YouTube, Uber, Kickstarter, Makerbot, Bitcoin, Netflix, streaming music services, etc. All are less costly and/or have better benefits than their prior alternatives.
In 1971, the US Supreme Court case of Griggs v Duke Power Co effectively banned employer aptitude testing of applicants. Employers had to resort to other signals about applicants and the college graduation race began. Colleges with their judicially created oligopoly became free to increase tuition without the possibility of employers developing their own alternative applicant aptitude signal. Students left with no other employer signaling mechanism are left with little choice but to pay the higher tuition.
Thursday, September 8, 2016
CBO's Projects Slower GDP Growth Due To Retiring Baby Boomers, Stable Participation Rate Of Working-Age Women, Work Disincentives Of Federal Taxes And Spending, Lower Productivity, And Crowding Out Of Private Investment By Federal Borrowings
From Congressional Budget Office, "Why Is CBO’s Projection of GDP Growth Slower Than Past Rates of Growth?" Posted by Robert Shackleton, analyst in CBO’s Macroeconomic Analysis Division, on September 8, 2016:
According to CBO’s most recently published projections, the economy is expected to grow substantially more slowly over the coming decade than it has over much of recent history. Whereas inflation-adjusted gross domestic product (GDP) grew by an average of 3.2 percent per year from 1950 to 2015—which is about the same as the average growth rate during the 25 years preceding the 2007–2009 recession—CBO expects that it will grow by only 2.0 percent per year over the coming decade.
In large part, the projected slowdown in economic growth is due to slower growth in the labor force. During the 1950–2015 period, growth was spurred by two factors: the large increase in the working-age population that was caused by the post–World War II baby boom and the rapid rise in women’s participation in the labor force. Driven by those factors, the labor force grew by an average of about 1½ percent per year from 1950 to 2015; the average rate of annual growth in the 25 years preceding the last recession was only slightly lower. More recently, the ongoing retirement of the baby boomers and the relatively stable labor force participation rate of working-age women have led to a decline in labor force growth. Because those trends are expected to continue, CBO projects that the labor force will grow at an average rate of only about ½ percent per year over the next decade. In addition to demographic factors, that projection reflects CBO’s judgment that some people will decide to work somewhat less because of federal tax and spending policies that are set in current law.
Slower growth in the labor force accounts for only about three-fifths of the projected slowdown in the growth of inflation-adjusted GDP; slower growth in labor force productivity accounts for the rest. Labor force productivity grew by an average of about 1¾ percent per year from 1950 to 2015; the average rate of annual growth was about the same in the 25 years preceding the last recession. However, CBO projects that labor force productivity will grow at an average annual rate of less than 1½ percent over the coming decade. That slowdown is attributable mainly to two other projections that CBO has made—namely, that growth in both capital services and total factor productivity (TFP, or output per unit of combined labor and capital services) in the nonfarm business sector of the economy will also be slower. Those projections reflect CBO’s expectation that some of the unusually slow growth of TFP during the past decade will persist over part of the next decade. They also reflect the agency’s projection of greater federal borrowing under the current laws governing taxes and spending, which would crowd out some private investment.
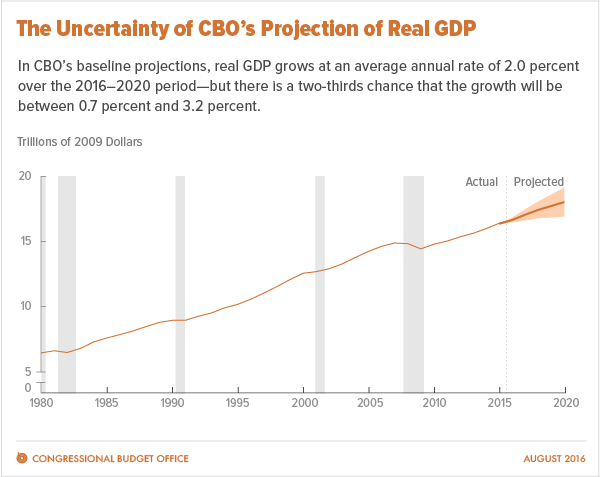
Uncertainty And Standard Deviations Of CBO's Forecasts Of Real GDP And Inflation
From Congressional Budget Office, "Uncertainties in the Economic Outlook" Posted by Charles Whalen, analyst in CBO’s Macroeconomic Analysis Division, on September 7, 2016:
On August 23, CBO published An Update to the Budget and Economic Outlook: 2016 to 2026, describing the agency’s projections for the federal budget and the U.S. economy over the next 10 years. As is always the case, economic outcomes will undoubtedly differ from CBO’s projections in some respects. Today, we discuss several uncertainties in the current economic outlook.*** Uncertainties
Recognizing the uncertainty of economic forecasts, CBO constructs its projections so that they fall in the middle of the distribution of possible outcomes, given current law and the economic data available when the projections are prepared. Nevertheless, many developments—such as economic growth abroad that was weaker than expected or growth in productivity that was faster than expected—could make outcomes differ substantially from what CBO has projected.*** To roughly quantify the degree of uncertainty in its projections for the next five years, CBO analyzed its past forecast errors for the growth rate of real GDP over five-year periods since 1976. Those errors have a standard deviation of about 1.3 percentage points: Thus, in CBO’s view, there is a two-thirds chance that the average annual growth rate of real GDP over the next five years will be between 0.7 percent and 3.2 percent (see the figure). Similarly, CBO’s forecast errors for inflation over five-year periods (as measured by the consumer price index for all urban consumers, which is generally higher than the PCE price index by about 0.4 percentage points per year owing to the different methods used to calculate them) have a standard deviation of 1.5 percentage points, which suggests that there is a two-thirds chance that inflation will average between 0.6 percent and 3.6 percent over the next five years.
Source: Congressional Budget Office
Thursday, September 1, 2016
Chart Of 2001 To 2014 Immigrant Deportations By US Department Of Homeland Security
From Pew Research Center, "U.S. immigrant deportations declined in 2014, but remain near record high" by Ana Gonzalez-Barrera and Jens Manuel Krogstad:
Source: Pew Research Center
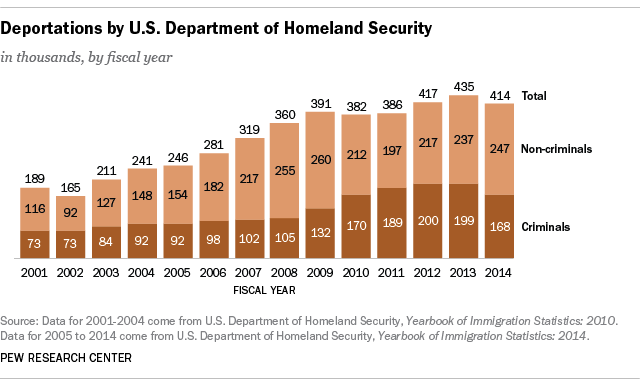
The Obama administration deported 414,481 unauthorized immigrants in fiscal year 2014, a drop of about 20,000 (or 5%) from the prior year, newly released Department of Homeland Security data show. A total 2.4 million were deported under the administration from fiscal 2009 to 2014, including a record 435,000 in 2013, according to a Pew Research Center analysis of the data.
"What Is Productivity?" New Video From US Bureau Of Labor Statistics
Fro US Bureau of Labor Statistics a new video, "What Is Productivity?"
The BLS productivity program is proud to release the video, “What is Productivity?” This video is intended to provide basic productivity concepts to a general audience and explain how growth in productivity leads to improvements in our lives. You can view the video at https://youtu.be/rIG237BJXQot
Tuesday, August 30, 2016
Reprint Of My June 1996 Letter To The US Treasury On The Need For GDP Indexed US Bonds Included In My Comment On Issuing Inflation Indexed Treasury Bonds
The following is a reprint of a letter I sent to the US Treasury on June 5, 1996, in response to its request for comments and information on inflation indexed bonds. At the time, Treasury was considering publishing a proposal on the details of issuing US government inflation indexed bonds. Included about midway through my comment is my still relevant recommendation for the issuance of GDP indexed bonds and bonds indexed to other economic indicators.
If a market for traded US GDP indexed bonds existed today, there would be much more certainty about the trajectory of short-term and long-term future US economic growth
Milton Recht
XXXXXXXXXXXXXX
XXXXXXXXXXXXXX, NY xxxxx
June 5, 1996
The Government Securities Regulations Staff
Bureau of the Public Debt
999 E Street NW
Room 515
Washington, DC 20220
Dear Sir:
I am writing to comment on the Treasury Department’s proposal to issue a new type of United States Government bond that adjusts for the effects of inflation. My comments relate to the riskiness, structure, and uses of an inflation indexed treasury bond.
RISK
One of the purposes motivating the planned issuance of an inflation protected bond is the protection of investors, both individual and institutional, from the risk of an unanticipated loss of purchasing power due to unforeseen inflation over the life of a bond. Expected inflation, as you well know, is already included in the expected yield of the bond. Implicit in the Treasury Department’s attempt at purchasing power protection is the assumption that protection against inflation shocks reduces the riskiness of the investment security.
Volatility or the standard deviation of the total return of a bond is a yardstick for gauging the risk of a potential decline in market value and a capital loss, and while an inflation indexed treasury bond does not yet trade in this country, estimates can be made of its expected volatility. Using data from Ibbotson, Stock Bonds Bills and Inflation 1996 Yearbook, the standard deviation of the total return of a treasury bond from 1929 to 1995 is 9.2% per year. The standard deviation of the CPI for the same period is 4.6% per year. A real return can be derived by removing inflation from the nominal return, and the standard deviation of the real return series can be measured. Due to the negative correlation between inflation and the computed total real return on a treasury bond, the standard deviation of the computed real return, which is the equivalent of an inflation adjusted bond, is higher than a regular treasury bond and is 10.6%. The implication is that an inflation adjusted bond will be about 15% riskier due to increased volatility than a regular treasury bond. This will most likely be true even if historical CPI has been overstated and is restated. Since inflation has a dampening effect on the total nominal return, and since real returns are more volatile than nominal returns, an inflation bond does not protect against purchasing power loss when the increase risk of capital loss is also considered. Marketing the bond as purchasing power protection without mentioning the increased risk of prior to maturity principal loss is misleading to the average investor, and a misleading statement by a mutual fund. The point is particularly important to mutual fund investors since the funds are constantly rolling over maturing debt into new securities and are maintaining a relatively constant average maturity and duration. An inflation indexed bond also will increase the cost of hedging for those institutions that will hold inflation indexed bonds, and that manage their asset liability mix, such as banks, savings institutions, and insurance companies.
CHOICE OF INDEX
If minimizing risk is one of the goals of issuing an inflation bond, than the choice of an inflation index should be partially determine by an objective measure of risk. The selection of an index, whether CPI, PPI, or GDP Deflator, should be based in part on which one of the many indices minimizes the volatility of the total real return of the bond, while providing an accurate measure of inflation.
RATIONAL EXPECTATIONS
All publicly traded securities, particularly those that trade in highly liquid markets with the availability of short-selling, contain in their prices the market’s expectations of the future outcomes of the states of the economy over the life of the bond. This concept of expectations theory and efficient market theory has been well studied and documented and generally applies quite well to the treasury market. The market does not make these expectations readily observable other than by changes in the price of the bond or equity.
The issuance of an inflation pegged security by the government is an important milestone for allowing the observation of the market’s forecast of important economic variables, such as inflation expectations, that impact public policy and debate. By comparing a zero coupon treasury bond with the equivalent maturity zero coupon inflation indexed bond, the market’s expectation of average inflation over that period until maturity can be determined. (Estimations of any tax effects can also be made so that they can be removed to get a truer picture of expected inflation.) This expectation of inflation will represent a politically and statistically unbiased best guess of inflation which will incorporate all available information about the future of the economy, which will quickly respond positively or negatively to anticipated policy changes, and which could be an important tool for the setting of monetary policy. It would therefore be useful to have zero coupon inflation bonds of several different maturities outstanding at any time.
INFLATION OR ANOTHER ECONOMIC INDICATOR
When viewed with the perspective that the issuance of an inflation indexed bond is a method of risk reduction and information gathering for policy formation, the fundamental question is whether inflation is the most important economic variable for risk protection and information gathering, or whether another economic variable as an adjustment factor for a treasury bond would serve more useful purposes and be better for the nation. Such a bond could be issued alone or with an inflation bond.
One of the greater problems for the U.S. in recent times has been the inability to achieve sustainable, strong, yet non-inflationary, economic growth. Strong economic growth, as you know, reduces the deficit problem, creates employment, increases real wages, increases tax revenues, and improves consumer confidence and a sense of well-being. The government and the private sector have been stymied by a lack of theory and knowledge about the best courses of actions to take to facilitate and achieve sustainable and strong growth in the economy.
Furthermore, the greatest risk that a business faces is usually that of a downturn in the economy, i.e. recession. A bond that was linked to the general economy, such as a bond whose interest payments were a fixed percentage of concurrently reported GDP, would act a barometer of future recessions and expansions. Zero coupon nominal GDP bonds in conjunction with zero coupon inflation bonds of the same maturities would allow the production of a yield curve of the future yearly expected growth rates of the economy, similar to the yield to maturity curves that are now produced using treasury bond data. The existence of a market in GDP linked bonds would allow short selling and the development of options on the bonds. Either of which could be used by businesses and individuals as hedges to reduce the effects of economic downturns. The information about future growth rates and the changes in the growth rates as policy changes are anticipated could be used by policy makers, academics, and the Federal Reserve to better understand the forces in our economy and to develop strategies for a long-term non-inflationary period of economic growth.
When shocks do occur to the economy, such as the oil price shocks of the 1970’s, the inflationary effects are much greater than would be anticipated by the price increase in the raw material or labor input. In fact, studies have shown that wage increases do not correlate with or predict future inflation, and that economic predictors based on historical or current data, such as the leading economic indicator index, are poor predictors of changes in the growth rate of the economy. Inflation in many cases, as in the 1970’s, represents a resource allocation problem as the economy makes a fundamental structural shift in its productive capacity. Therefore the risk that concerns individuals and the government is more closely aligned to GDP than an inflation index. Bonds linked to GDP would allow hedging of this risk and provide data on the market’s expectation of future economic growth. Reliable data about future economic growth would allow for better production planning and resource allocation which in themselves would substantially mitigate changes in prices and inflationary concerns.
RECOMMENDATION
The Treasury should issue inflation indexed bonds, particularly zero coupons bonds of differing maturities, but it should also recognize that the bonds’ volatility and therefore their risk may be greater than regular treasury bonds. The issuance of inflation indexed bonds is an important milestone for the issuance of bonds that can provide valuable information about the future of the economy, and consideration should be given to bonds linked to other economic variables. Bonds with an index linked to GDP may provide greater risk protection to businesses and individuals than inflation indexed bonds. GDP indexed bonds can provide reliable information about the future growth rates of the economy, and the improved accuracy of the information will lead to better production planning, resource allocation, and monetary policy, which will reduce inflationary pressures in the economy.
Thank you for reading my comments on an inflation adjusted bond. If any clarification is necessary, please feel free to contact me.
Sincerely,
/signed/
Milton Recht
If a market for traded US GDP indexed bonds existed today, there would be much more certainty about the trajectory of short-term and long-term future US economic growth
XXXXXXXXXXXXXX
XXXXXXXXXXXXXX, NY xxxxx
June 5, 1996
The Government Securities Regulations Staff
Bureau of the Public Debt
999 E Street NW
Room 515
Washington, DC 20220
Dear Sir:
I am writing to comment on the Treasury Department’s proposal to issue a new type of United States Government bond that adjusts for the effects of inflation. My comments relate to the riskiness, structure, and uses of an inflation indexed treasury bond.
RISK
One of the purposes motivating the planned issuance of an inflation protected bond is the protection of investors, both individual and institutional, from the risk of an unanticipated loss of purchasing power due to unforeseen inflation over the life of a bond. Expected inflation, as you well know, is already included in the expected yield of the bond. Implicit in the Treasury Department’s attempt at purchasing power protection is the assumption that protection against inflation shocks reduces the riskiness of the investment security.
Volatility or the standard deviation of the total return of a bond is a yardstick for gauging the risk of a potential decline in market value and a capital loss, and while an inflation indexed treasury bond does not yet trade in this country, estimates can be made of its expected volatility. Using data from Ibbotson, Stock Bonds Bills and Inflation 1996 Yearbook, the standard deviation of the total return of a treasury bond from 1929 to 1995 is 9.2% per year. The standard deviation of the CPI for the same period is 4.6% per year. A real return can be derived by removing inflation from the nominal return, and the standard deviation of the real return series can be measured. Due to the negative correlation between inflation and the computed total real return on a treasury bond, the standard deviation of the computed real return, which is the equivalent of an inflation adjusted bond, is higher than a regular treasury bond and is 10.6%. The implication is that an inflation adjusted bond will be about 15% riskier due to increased volatility than a regular treasury bond. This will most likely be true even if historical CPI has been overstated and is restated. Since inflation has a dampening effect on the total nominal return, and since real returns are more volatile than nominal returns, an inflation bond does not protect against purchasing power loss when the increase risk of capital loss is also considered. Marketing the bond as purchasing power protection without mentioning the increased risk of prior to maturity principal loss is misleading to the average investor, and a misleading statement by a mutual fund. The point is particularly important to mutual fund investors since the funds are constantly rolling over maturing debt into new securities and are maintaining a relatively constant average maturity and duration. An inflation indexed bond also will increase the cost of hedging for those institutions that will hold inflation indexed bonds, and that manage their asset liability mix, such as banks, savings institutions, and insurance companies.
CHOICE OF INDEX
If minimizing risk is one of the goals of issuing an inflation bond, than the choice of an inflation index should be partially determine by an objective measure of risk. The selection of an index, whether CPI, PPI, or GDP Deflator, should be based in part on which one of the many indices minimizes the volatility of the total real return of the bond, while providing an accurate measure of inflation.
RATIONAL EXPECTATIONS
All publicly traded securities, particularly those that trade in highly liquid markets with the availability of short-selling, contain in their prices the market’s expectations of the future outcomes of the states of the economy over the life of the bond. This concept of expectations theory and efficient market theory has been well studied and documented and generally applies quite well to the treasury market. The market does not make these expectations readily observable other than by changes in the price of the bond or equity.
The issuance of an inflation pegged security by the government is an important milestone for allowing the observation of the market’s forecast of important economic variables, such as inflation expectations, that impact public policy and debate. By comparing a zero coupon treasury bond with the equivalent maturity zero coupon inflation indexed bond, the market’s expectation of average inflation over that period until maturity can be determined. (Estimations of any tax effects can also be made so that they can be removed to get a truer picture of expected inflation.) This expectation of inflation will represent a politically and statistically unbiased best guess of inflation which will incorporate all available information about the future of the economy, which will quickly respond positively or negatively to anticipated policy changes, and which could be an important tool for the setting of monetary policy. It would therefore be useful to have zero coupon inflation bonds of several different maturities outstanding at any time.
INFLATION OR ANOTHER ECONOMIC INDICATOR
When viewed with the perspective that the issuance of an inflation indexed bond is a method of risk reduction and information gathering for policy formation, the fundamental question is whether inflation is the most important economic variable for risk protection and information gathering, or whether another economic variable as an adjustment factor for a treasury bond would serve more useful purposes and be better for the nation. Such a bond could be issued alone or with an inflation bond.
One of the greater problems for the U.S. in recent times has been the inability to achieve sustainable, strong, yet non-inflationary, economic growth. Strong economic growth, as you know, reduces the deficit problem, creates employment, increases real wages, increases tax revenues, and improves consumer confidence and a sense of well-being. The government and the private sector have been stymied by a lack of theory and knowledge about the best courses of actions to take to facilitate and achieve sustainable and strong growth in the economy.
Furthermore, the greatest risk that a business faces is usually that of a downturn in the economy, i.e. recession. A bond that was linked to the general economy, such as a bond whose interest payments were a fixed percentage of concurrently reported GDP, would act a barometer of future recessions and expansions. Zero coupon nominal GDP bonds in conjunction with zero coupon inflation bonds of the same maturities would allow the production of a yield curve of the future yearly expected growth rates of the economy, similar to the yield to maturity curves that are now produced using treasury bond data. The existence of a market in GDP linked bonds would allow short selling and the development of options on the bonds. Either of which could be used by businesses and individuals as hedges to reduce the effects of economic downturns. The information about future growth rates and the changes in the growth rates as policy changes are anticipated could be used by policy makers, academics, and the Federal Reserve to better understand the forces in our economy and to develop strategies for a long-term non-inflationary period of economic growth.
When shocks do occur to the economy, such as the oil price shocks of the 1970’s, the inflationary effects are much greater than would be anticipated by the price increase in the raw material or labor input. In fact, studies have shown that wage increases do not correlate with or predict future inflation, and that economic predictors based on historical or current data, such as the leading economic indicator index, are poor predictors of changes in the growth rate of the economy. Inflation in many cases, as in the 1970’s, represents a resource allocation problem as the economy makes a fundamental structural shift in its productive capacity. Therefore the risk that concerns individuals and the government is more closely aligned to GDP than an inflation index. Bonds linked to GDP would allow hedging of this risk and provide data on the market’s expectation of future economic growth. Reliable data about future economic growth would allow for better production planning and resource allocation which in themselves would substantially mitigate changes in prices and inflationary concerns.
RECOMMENDATION
The Treasury should issue inflation indexed bonds, particularly zero coupons bonds of differing maturities, but it should also recognize that the bonds’ volatility and therefore their risk may be greater than regular treasury bonds. The issuance of inflation indexed bonds is an important milestone for the issuance of bonds that can provide valuable information about the future of the economy, and consideration should be given to bonds linked to other economic variables. Bonds with an index linked to GDP may provide greater risk protection to businesses and individuals than inflation indexed bonds. GDP indexed bonds can provide reliable information about the future growth rates of the economy, and the improved accuracy of the information will lead to better production planning, resource allocation, and monetary policy, which will reduce inflationary pressures in the economy.
Thank you for reading my comments on an inflation adjusted bond. If any clarification is necessary, please feel free to contact me.
Sincerely,
/signed/
Milton Recht
Monday, August 29, 2016
US Household Out Of Pocket Healthcare Spending Rose Steadily From 2004 To 2014 Despite Recession And Obamacare: Health Insurance Premiums Are Biggest Healthcare Expense For All Income Groups
From US Department of Labor, US Bureau of Labor Statistics, Beyond The Numbers, "Household healthcare spending in 2014" by Ann C. Foster:
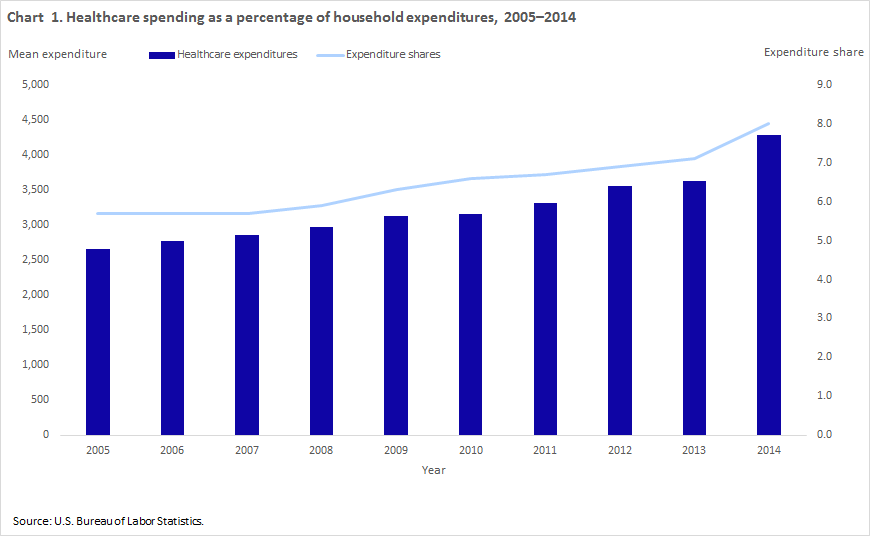
Household healthcare spending has increased in dollar amount and as a share of household spending, even during the last recession when average household expenditures (and pretax income) declined. Consumer Expenditure Survey (CE) data show that household out-of-pocket healthcare spending rose steadily from an average of $2,664 (in nominal dollars) in 2005 to $4,290 in 2014 while the share of the household budget accounted for by healthcare spending held steady at 5.7 percent over the 2005–2007 period, but increased to 8 percent in 2014. (See chart 1.) In contrast, average total household expenditures rose from $46,409 in 2005 to $50,486 in 2008, then fell from 2009 to 2011. Spending increased to $51,442 in 2012, fell to $51,110 in 2013, and then rose once again to $53,495 in 2014.
Source: US Bureau of Labor Statistics *** Health insurance
Health insurance premiums accounted for the greatest proportion of healthcare spending among households at all income levels.This category includes spending for private health insurance obtained individually or through a group plan and for amounts for Medicare Part B and Part D coverage.
Obama Has Maxed Out The US Credit Card: He Leaves Clinton, Trump Too Poor For Infrastructure Spending, Free College, Daycare, Military, Etc.
From The Wall Street Journal, Opinion, "Another Obama Parting Gift: His final fiscal year federal budget deficit will increase by 35%:"
For the 2016 fiscal year that ends next month, CBO now forecasts that revenues will rise by only $26 billion while outlays will increase by some $178 billion. The federal deficit will therefore rise from $438 billion to $590 billion, the biggest deficit since 2013.With the CBO projected trajectory of increased future US debt under current government programs, even increases in tax revenues, as proposed by Clinton and others, will not give the next president money to establish new government funded programs.
*** As a share of the national economy, debt held by the public—the kind the Treasury must repay—will increase to 76.6% [of GDP] this fiscal year. That’s the highest share of GDP since 1950 when the debt burden was winding down after World War II. It was 52.3% in President Obama’s first year in office, and it usually is flat or falls during an economic expansion.
Source: The Wall Street Journal
No such debt reduction is on the horizon now. Thanks to ObamaCare and his refusal to reform entitlements, Mr. Obama has set the federal fisc on an even uglier path long after he’s left for a tour of the world’s great golf courses. CBO says spending will keep rising and so will debt as a share of GDP—to 77.2% in 2017, 79.3% in 2021 and 85.5% in 2026. (See the nearby chart.) All of this assumes no change in current policy and no economic recession. The odds of the latter are close to zero. [Emphasis added.]

Friday, August 26, 2016
Middle-Class Family Healthcare Spending Increased 25 Percent Since 2007
From The Wall Street Journal, "Burden of Health-Care Costs Moves to the Middle Class: Rising out-of-pocket health care costs ‘means less money for other things’ " by Anna Louie Sussman:
Source: The Wall Street Journal *** Rising out-of-pocket health-care costs, combined with slow economic growth and years of tepid wage growth, pose risks for an economy in which consumer spending accounts for more than two-thirds of overall output, economists say. In 2015, 8% of Americans’ household spending went toward health care, up from 5.8% in 2007, according to the Labor Department.
Health care costs are “eating up a larger share, and it means less money for other things,” said Diane Swonk of consultancy DS Economics.

Thursday, August 25, 2016
Democrats And Republicans See The Other Party As Ideologically Extreme, But Not Their Own
From PewResearchCenter, "Partisans see opposing party as more ideological than their own" by Zachary Krislov and Jocelyn Kiley:
Members of both parties most commonly place the other party on the extreme end of the scale. Among Democrats, 34% placed the GOP at the most conservative point. Even more Republicans – 45% – put the Democratic Party at the liberal extreme.
Source: PewResearchCenter
Majorities in both parties view the other party as closer to the ideological extreme than the center. Nearly six-in-ten Democrats (58%) place the Republican Party at one of the three most conservative points on the scale (0-2), while 69% of Republicans place the Democratic Party on the most liberal points (8-10).
Meanwhile, partisans consider their own party to be less ideological. While most Republicans place the GOP on the conservative side of the scale, only 36% rate it as very conservative (0-2 on the scale). Similarly, most Democrats view their own party as liberal but just 33% rate it at the most liberal points on the scale (8-10).

EpiPen Costs $500 Because The FDA Will Not Allow Generic Competitors
From The Wall Street Journal, Opinion, "Anaphylactic Political Shock: Sorry, Hillary. The feds are to blame for Mylan’s EpiPen monopoly:"
EpiPen should be open to generic competition, which cuts prices dramatically for most other old medicines. Competitors have been trying for years to challenge Mylan’s EpiPen franchise with low-cost alternatives—only to become entangled in the Food and Drug Administration’s regulatory afflatus.
Approving a generic copy that is biologically equivalent to a branded drug is simple, but the FDA maintains no clear and consistent principles for generic drug-delivery devices like auto injectors or asthma inhalers. How does a company prove that a generic device is the same as the original product if there are notional differences, even if the differences don’t matter to the end result? In this case, that means immediately injecting a kid in anaphylactic shock with epinephrine—which is not complex medical engineering.
But no company has been able to do so to the FDA’s satisfaction.
Thursday, August 18, 2016
Rate Of Violence Against Educators Is Twice The Rate Of Violence Against All Workers
From US Department of Labor, Bureau of Labor Statistics, Monthly Labor Review 100 Years, Featured Article, August 2016, "Putting violence in perspective: how safe are America’s educators in the workplace?"

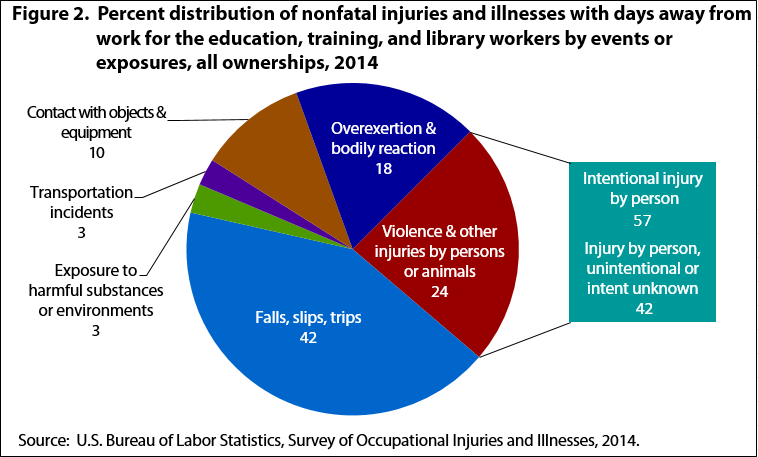
Out of the 8.4 million workers employed in the education, training, and library occupations throughout the United States in 2014, 27 died on the job and 36,540 had nonfatal occupational injuries and illnesses that resulted in days away from work. Compared with all workers in the United States, those in the education, training, and library occupations (henceforth referred to as “educators”) were at less risk of both fatal injuries and nonfatal injuries and illnesses. The fatal injury incidence rate for educators, at 0.4 per 100,000 workers, was significantly lower than the rate for all workers (3.4 per 100,000 workers). Likewise, the nonfatal injury and illness incidence rate for educators for days away from work was 59 cases per 10,000 full-time workers and was almost half the rate for all workers at 107.1 per 10,000 full-time workers. All work injuries and illnesses are unfortunate, but among them, events of violence and other injuries by persons or animals (henceforth referred to as “violent events”) stand out as preventable. Violent events from 2011 through 2014 composed 27 percent (29 deaths) of the fatal injuries of educators. In 2014, they composed 24 percent of the nonfatal days-away-from-work cases (8,620 cases) that educators experienced. This article explores occupational fatal injuries and nonfatal injuries and illnesses that resulted in days away from work for educators, with a focus on violent events.
Types of violent events affecting educators
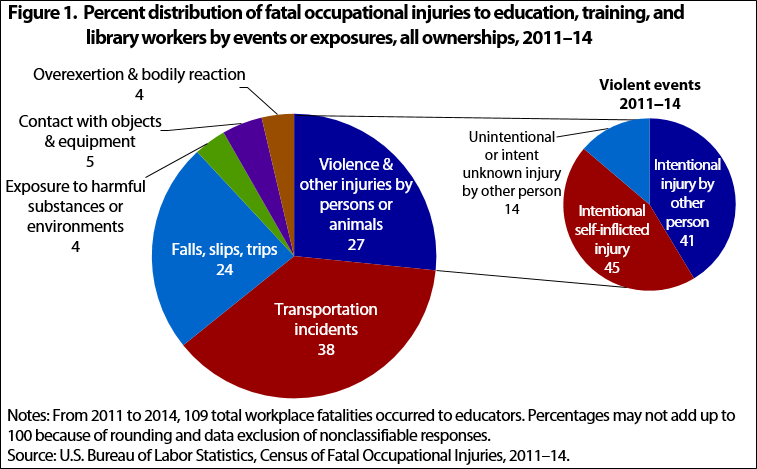
For this article, violent events are considered any event that falls into event category 1 in the Occupational Injury and Illness Classification System 2.01 coding structure. This category includes all intentional injuries (homicides and suicides), injuries involving weapons, and injuries from direct physical contact by another person or oneself. From 2011 through 2014, 109 educators were fatally injured on the job. Violent events accounted for 27 percent of fatal injuries (29 deaths) to educators and were the second most frequent type of fatal incident after transportation incidents (see figure 1). Of the educators who were fatally injured in violent events from 2011 through 2014, 69 percent (20 of the 29) were employed in state or local government. Of the 29 violent deaths, 25 were reported as intentional injuries by persons (this category includes injuries by other persons and self-inflicted injuries or suicides). Self-inflicted intentional injuries numbered 13 of the 29 violent fatalities (45 percent), and intentional injuries (i.e., homicides) by other person were the second most common fatal violent event, with 12 fatalities. Among the educators who were victims of homicides from 2011 through 2014, eight occurred as intentional shootings by other persons (67 percent). Four cases were classified as “injury by other person—unintentional or intent unknown.” These cases can include accidental shootings or physical contact during activities such as sports or attempts to restrain another person.
Of the 36,540 nonfatal injuries and illnesses that resulted in days away from work reported in 2014 for educators, nearly a quarter (8,620 cases) were the result of violent events (see figure 2). The share of the number of violent events to all nonfatal days-away-from-work cases was more than three times higher for educators than for all workers in the United States in 2014. Also, the incidence rate of violent events among educators (13.9 per 10,000 full-time workers) was almost twice the incidence rate (6.8) of violent events for all workers in the United States. Compared with major occupation groups with high rates of violent nonfatal events, educators were at low risk. For example, protective service workers (such as police officers or fire fighters) or healthcare support workers (such as home health aides or personal care assistants) had higher rates, at least by a factor of two, of violent events at work than educators (see table 1). [Empahsis added.] [Footnotes Omitted.]
Tuesday, August 16, 2016
Computers More Accurate Than Pathologists In Assessing Lung Cancer Tissues
From ScienceBlog, Aug 16, 2016, "Computers trounce pathologists in predicting lung cancer type, severity:"
Computers can be trained to be more accurate than pathologists in assessing slides of lung cancer tissues, according to a new study by researchers at the Stanford University School of Medicine.
The researchers found that a machine-learning approach to identifying critical disease-related features accurately differentiated between two types of lung cancers and predicted patient survival times better than the standard approach of pathologists classifying tumors by grade and stage.
“Pathology as it is practiced now is very subjective,” said Michael Snyder, PhD, professor and chair of genetics. “Two highly skilled pathologists assessing the same slide will agree only about 60 percent of the time. This approach replaces this subjectivity with sophisticated, quantitative measurements that we feel are likely to improve patient outcomes.”
The research will be published Aug. 16 in Nature Communications.
Rising Wage Inequality Driven By Growing Differences In Pay Across Industries And Businesses And Not Within Firms
From The Wall Street Journal, Real Time Economics, "When Unequal Pay Makes Everyone Less Productive: A study of hundreds of Indian workers shows pay inequity affects output and attendance" by Adam Creighton:
In advanced countries, income inequality has been increasing. Other research suggests employers are alive to the potentially damaging effects of paying close colleagues too differently. A study of U.S. wage dispersion from 1978 to 2012 indicated rising inequality was being driven by growing differences in pay across industries and businesses, rather than within them.
"Pay differences within employers have remained virtually unchanged, a finding that is robust across industries, geographical regions, and firm-size groups," researchers found.
Trust In Government Never Lower, As Measured By Gallup
From The Wall Street Journal, Opinion, "Trust in Business vs. Government: The public likes the private economy more than the politicians do:"
... the five industries that Gallup found are viewed more negatively than positively on net: oil and gas (minus-7), lawyers (minus-8), health care (minus-20) and pharmaceuticals (minus-23). Public opinion for health care has plunged to a five-year low, which also corresponds to its rough annexation by the federal government under ObamaCare.
Speaking of which, the worst performer in the Gallup survey? None other than the federal government, with merely 28% expressing a positive view and 55% a negative one for a net rating of minus-27 points. The pollster reports that "trust in the government’s ability to handle domestic problems has never been lower in Gallup’s trends, which stretch back to the 1970s."
Friday, August 12, 2016
Thursday, August 4, 2016
State Map Of Relative Value Of $100
From Tax Foundation, "The Real Value of $100 in Each State" by Alan Cole:
*** The states where $100 is worth the most are Mississippi ($115.34), Arkansas ($114.29), Alabama ($113.90), South Dakota ($113.64), and West Virginia ($112.49). In contrast, $100 is effectively worth the least in the District of Columbia ($84.67), Hawaii ($85.62), New York ($86.43), New Jersey ($87.34), and California ($88.97).
This map shows the real value of $100 in each state. Prices for the same goods are often much cheaper in states like Missouri or Ohio than they are in states like New York or California. As a result, the same amount of cash can buy you comparatively more in a low-price state than in a high-price state.***
Source: Tax Foundation

Wednesday, August 3, 2016
Lengthen Student Loan Payback Time To Increase Millennials' Retirement Savings And Home Purchases
My posted comment to The Wall Street Journal article, "Most Millennials Don’t See Becoming Millionaires, Study Finds: Tough job market and high student debt has many doubtful they will bank a million dollars for retirement" by Veronica Dagher:
The current maximum Roth IRA contribution is $5500 per year or about $105 per week. A 25 year old putting $105 per week into a diversified mutual fund or ETF, such as an S&P 500 index, for 40 years until retirement at 65, with an average total return over the 40 years of 6 percent, will have over $900,000, tax free, in the Roth IRA. If the 40 year average return is 8 percent, the total will be $1.6 million. A 10 year delay in saving will reduce the $900,000 accumulated savings to $460,000 and the $1.6 million to $680,000. The earlier one starts saving, due to compounding, the more one has at retirement.
The biggest problem with student loan debt is not the amount, or the interest rate. It is the ridiculously short payback period of 10 years. Education is a life long investment. Increasing the payback period to 20 years, decreases monthly payments by almost 40 percent. A longer payback time for student loans will increase funds for home purchases and retirement savings.
Tuesday, August 2, 2016
US Net Interest Costs To Increase From 6 Percent To 21 Percent Of Federal Spending Over Next 30 Years: CBO
From the Congressional Budget Office, "Interest Costs in The Long-Term Budget Outlook" Posted by Stephanie Barello and Michael Simpson on August 2, 2016:
The government’s net interest costs are projected to more than double as a share of the economy over the next decade—from 1.4 percent of GDP in 2016 to 3.0 percent by 2026. By 2046, if current laws governing taxes and spending generally did not change, those costs would reach 5.8 percent of GDP—increasing from 6 percent of federal spending to 21 percent over the next 30 years.
Source: Congressional Budget Office
Net interest costs are projected to increase as interest rates rise from unusually low levels and as greater federal borrowing directly leads to greater debt-service costs. In addition, greater federal borrowing is projected to put further upward pressure on interest rates and thus on interest costs. Growth in net interest costs and growth in debt reinforce each other: Rising interest costs push up deficits and debt, and rising debt pushes up interest costs.

Saturday, July 30, 2016
Slowest US Post Recession Economic Expansion (GDP Growth) Since 1949: Chart
From The Wall Street Journal, "U.S. GDP Grew a Disappointing 1.2% in Second Quarter: Economic growth was well below expectations; cautious business investment offset robust consumer spending" by Eric Morath and Jeffrey Sparshott:
Source: The Wall Street Journal

Continuing Decline In Business Investment Is Causing Slow Growth In Productivity, Wages And Jobs
From The Wall Street Journal, Opinion, "Make America Grow Again: The economy is stuck on 1% growth as business investment stalls:"
The [2016] second quarter suffered in particular from the same malaise that has marked nearly the entire Obama era—poor business investment. Consumer spending rose smartly at 4.2% in the second quarter, but business investment fell at a 2.2% pace, and companies ran down inventories for the fifth consecutive quarter.
Source: The Wall Street Journal
The nearby chart shows the quarterly contribution to GDP from private “nonresidential fixed investment” since 2013. Business spending on the likes of new factories, equipment and software has subtracted from growth for three straight quarters. Apart from a stretch in 2014, the last three years have been historically weak.
This matters because business investment spurs the growth and productivity gains that produce more jobs and higher wages. As resilient as consumers have been, they can’t drive growth by themselves.

Subscribe to:
Posts (Atom)