United has tracked migration patterns annually on a state-by-state basis since 1977. For 2016, the study is based on household moves handled by United within the 48 contiguous states and Washington, D.C. This study ranks states based off the inbound and outbound percentages of total moves in each state. United classifies states as “high inbound” if 55 percent or more of the moves are going into a state, “high outbound” if 55 percent or more moves were coming out of a state or “balanced” if the difference between inbound and outbound is negligible.
Moving In: The top inbound states of 2016 were:South Dakota is the most popular moving destination of 2016 with nearly 68 percent of moves to and from the state being inbound. The state has continued to climb the ranks, increasing inbound migration by 23 percent over the past five years. New to the 2016 top inbound list are South Dakota at No. 1 and Arizona at No. 10 with 68 and 57 percent inbound moves, respectively.
- South Dakota
- Vermont
- Oregon
- Idaho
- South Carolina
- Washington
- District of Columbia
- North Carolina
- Nevada
- Arizona
Moving Out: The top outbound states for 2016 were:In addition to the Northeast, Illinois (63 percent) moved up one spot on the outbound list, to no. 2, ranking in the top five for the last eight years.
- New Jersey
- Illinois
- New York
- Connecticut
- Kansas
- Kentucky
- West Virginia
- Ohio
- Utah
- Pennsylvania
New additions to the 2016 top outbound list include Kentucky (58 percent), Utah (56 percent) and Pennsylvania (56 percent).
Monday, July 3, 2017
Top Ten States With Most Inbound And Outbound Movers: United Van Lines Ranking
From United Van Lines, 2016 National Movers Study, "Retirees Moving to Mountain and Pacific West:"

Friday, June 30, 2017
Women Get About 25 Minutes More Sleep Per Night Than Men According To Fitbit Data
From Fitbit, Fitbit News, "How Much Sleep Do Fitbit Users Really Get? A New Study Finds Out" by Danielle Kosecki:
The Gender Sleep Gap
For the second year in a row Fitbit data scientists found women get about 25 minutes more sleep on average each night compared to men. The percentage of time spent in each sleep stage was also similar—until you factor in age.
Thursday, June 29, 2017
The Poor, The Middle Income, And The Wealthy Spend A Large Share Of Income On Luxuries
From MarketWatch, "Low-income families spend 40% of their money on luxuries" by Leslie Albrecht:
The wealthiest families (the top fifth of earners) spend around 65% of their incomes on luxury goods and 35% on necessities, according to the study, which looked at spending habits between 1984 and 2014. Middle-income households weren’t far behind: They spend 50% on luxuries and 50% on necessities.
Even the lowest income families (the bottom fifth of earners) spend 40% on luxuries and 60% on necessities, according to the study’s author, Torsten Slok, chief international economist for Deutsche Bank Securities.
 |
| Source: |
The median household income in the U.S. recently rose to $59,361.
The bottom two fifths of earners made $47,300 or less in 2014, according the Tax Policy Center. The middle two fifths made between $47,300 and $134,300 and the top fifth made more than $134,300.
Friday, June 16, 2017
18 States Plus DC Still Have Estate Or Inheritance Taxes Or Both As Other States Eliminate Death Taxes
From The Wall Street Journal, "Why More States Are Killing Estate Taxes: Competition between states for wealthy taxpayers is fueling tax cuts" by Laura Saunders:
***
In the last three years, nine states have eliminated or lowered their estate taxes, mostly by raising exemptions.
 |
| Source: The Wall Street Journal |
Friday, June 9, 2017
Canada's Universal Health Care Has Poorer Serious Illness Outcomes And Longer Wait Times For Medical Procedures Than US Health System: US Medicare Coverage Is More Comprehensive Than Canada’s Medicare
From Wharton, Knowledge@Wharton, "Is Canada the Right Model for a Better U.S. Health Care System?":
Still, “there are some things we can learn” by studying the Canadian system, [Mark] Pauly [Wharton professor of health care management] argues. “Number one, although in many ways the system looks like ours, the system has a much greater emphasis on primary care and less emphasis on specialist care and hospitalization, and on complex and costly procedures. And that probably contributes a lot to the lower spending [in Canada], because while primary care can be good for you, expensive procedures such as for cancer may add only a few months of life but cost hundreds of thousands of dollars.”
Pauly adds, “Ordinary people in Canada are healthier than in the U.S., but outcomes for cancer and very serious illnesses are less good there. It’s a great place to live as long as you don’t get too sick, as one critic put it.”
Another fact that might dissuade Americans from duplicating the Canadian model, Pauly adds, is that “Canadians have a longer waiting list for things like joint replacement, so if your hips are killing you in Canada, you may wait months for that [surgery] to happen. In the U.S., the orthopedic surgeons are calling you every day, wondering when you are going to come in for your joint replacement procedure. We probably do too many; they probably do too few. But the safety valve for Canada is that they can always come across the border, and have a procedure done here.”’*** [Michael] Decter [a former deputy minister of health for Ontario] says. “Medicare [in the U.S.], which clicks in at 65, is more comprehensive than Canadian Medicare; it pays for a lot of services that we don’t pay for.
Thursday, June 8, 2017
Despite Politicians Claims, State Funding Levels Have Little Effect On Public College Tuition
From The Wall Street Journal, "What Causes High Tuition? Don’t Trust Your Intuition: When states cut spending by $100, students at public colleges do pay more—but the increase is only $5." by Preston Cooper:
Tuition goes up no matter what state legislators do. Public colleges, with state boundaries insulating them from competition, and generous federal student aid programs at their disposal, charge as much as they can get away with. Changes in state funding are largely irrelevant.
In a new study, I compare tuition and direct state funding changes at four-year public colleges between 2004 and 2015. This covers both a boom in state funding (2004-08) and a bust (2008-12). Sure enough, the relationship is quite weak. Less than 5% of changes in state funding pass through to higher tuition. In other words, if funding falls by $100 per student, tuition will rise by less than $5.
Colleges do tend to cut spending when state funding goes down. But the expenditures they cut are usually in areas unrelated to instruction, such as research and administration. When funding goes up, colleges largely plow that money into higher spending rather than return it to students through lower tuition.
Wednesday, May 31, 2017

Wednesday, May 24, 2017
US Oil Producers Increase Oil Production To Offset Opec, Russia Cuts
From The Wall Street Journal, "How American Shale Drillers Flipped OPEC’s Script: U.S. output has surged since production deal, leaving cartel with little choice but to extend cuts" by Lynn Cook:
When the cartel reached a landmark deal in November to curtail production to bolster crude prices, it was betting U.S. shale drillers would be too weak to step in and fill the void. It was wrong.
*** U.S. oil output has surged since the OPEC deal, and is now on pace to exceed 9.9 million barrels a day in 2018, a record, according to the U.S. Energy Information Administration.***
Source: The Wall Street Journal
While OPEC, Russia and others have struggled to curb their output by a combined 1.8 million barrels a day since their agreement was announced in November, the U.S. is pumping 750,000 barrels a day more. That has put American production at 9.3 million barrels a day, a level not seen since the summer of 2015, according to federal data.

Friday, May 19, 2017

Thursday, May 11, 2017
Fourth Quarter Gross Domestic Product By State: Chart
From Bureau of Economic Analysis, "Gross Domestic Product by State: Fourth Quarter and Annual 2016: Finance and Insurance Led Growth Across States in the Fourth Quarter:"
Real gross domestic product (GDP) increased in every state and the District of Columbia in the fourth quarter of 2016, according to statistics on the geographic breakout of GDP released today by the U.S. Bureau of Economic Analysis. Real GDP by state growth ranged from 3.4 percent in Texas to 0.1 percent in Kansas and Mississippi (chart 1). Finance and insurance; retail trade; and professional, scientific, and technical services were the leading contributors to U.S. economic growth in the fourth quarter.
 |
| Source: Bureau of Economic Analysis |
Wednesday, May 10, 2017
Monday, May 8, 2017
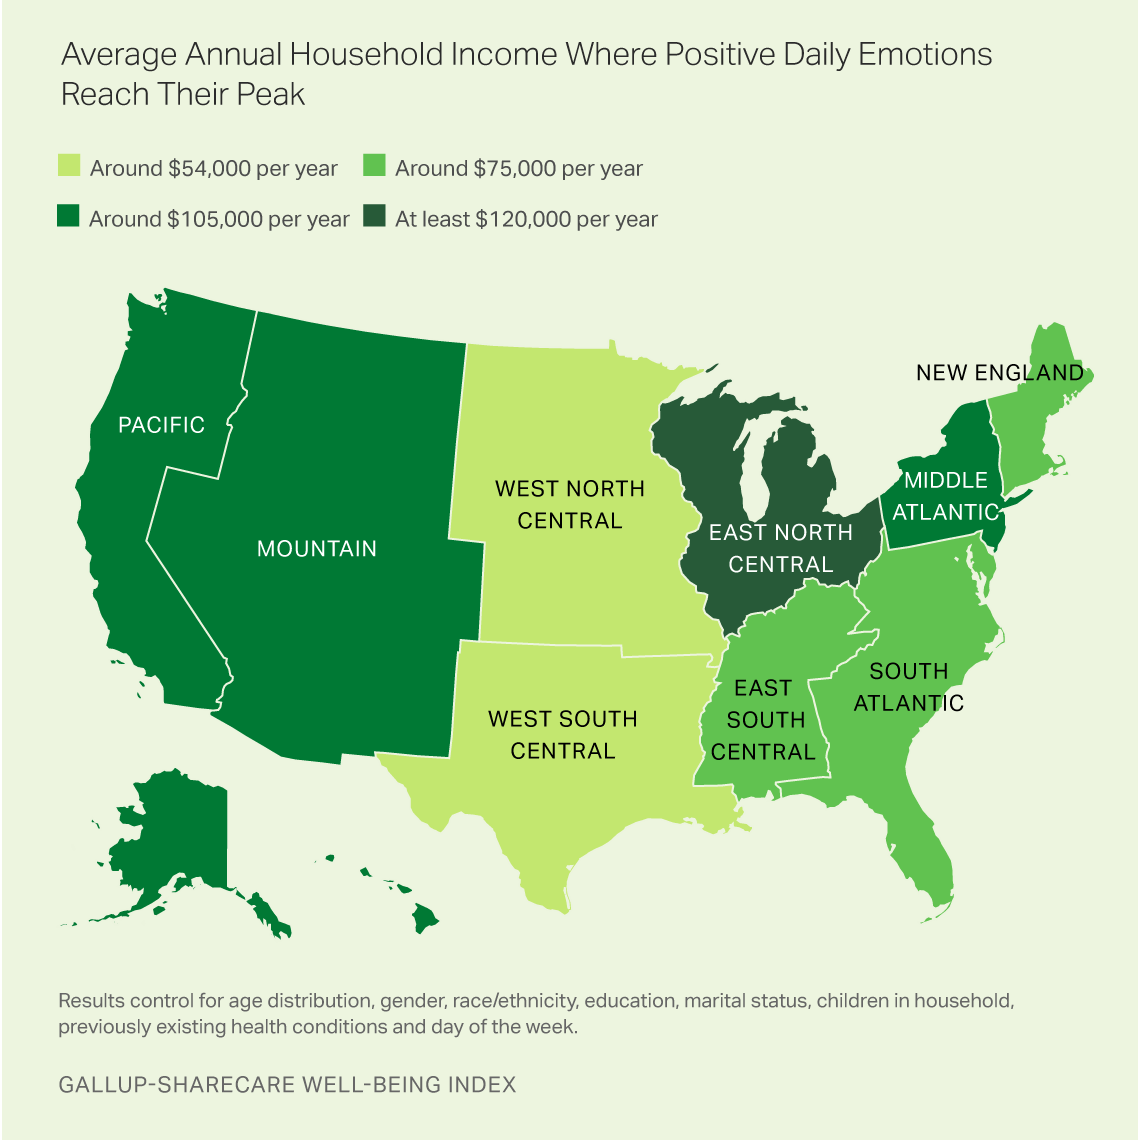
Income Needed For Daily Happiness Varies Regionally: Map
From Gallup, "Income Buys Happiness Differently Based on Where You Live" by Dan Witters and Diana Liu:
In the U.S., the chances of experiencing three positive emotions or actions -- happiness, enjoyment and smiling/laughter -- on any given day increases with household income. But those chances reach their limit at around $75,000 per year.
This limit varies regionally, however. Some areas maximize positive emotions at much lower income levels than others.
For example, adult residents of the West North Central and West South Central regions both reach their peak emotional potential at around $54,000 per year. Residents of the East North Central region, on the other hand, require heftier incomes -- at least $120,000 per year -- to achieve the same level.
Friday, May 5, 2017
CBO Presentation Of The 2017 US Budget and Economic Outlook
From the Congressional Budget Office, "The 2017 Budget and Economic Outlook" May 5, 2017, Presentation by Jeff Werling, Assistant Director, Macroeconomic Analysis Division:
Wednesday, May 3, 2017
Just 1 In 3 Homes Have Surpassed Their Pre-Recession Peak Price
From Bloomberg, "Most U.S. Homes Are Worth Less Than Before the Crash: Housing bubble? There are still more losers than winners in this recovery, Trulia says." by Patrick Clark [Based on a Trulia report, "The Housing Recovery That Wasn’t" by Ralph McLaughlin]:
Nationally, just 1 in 3 homes are worth more now than they were at their peak. While tech hubs in the Bay Area and Denver and job centers like Dallas or Nashville have seen home values explode past earlier highs, there are more losers than winners when you look across the country, Trulia’s analysis shows. And it’s really bad news if you live in Las Vegas, Tucson—or Fresno.
Source: Bloomberg
Many of the losers aren’t just losing—they’re getting trounced. There were 28 metros where fewer than 10 percent of homes have recovered their value since the bubble burst. Las Vegas has seen less than 1 percent of its homes returning to or surpassing what they were worth before the recession. The median sales price there is down a full $91,000 from its peak.
***
Source: Bloomberg


Friday, April 28, 2017
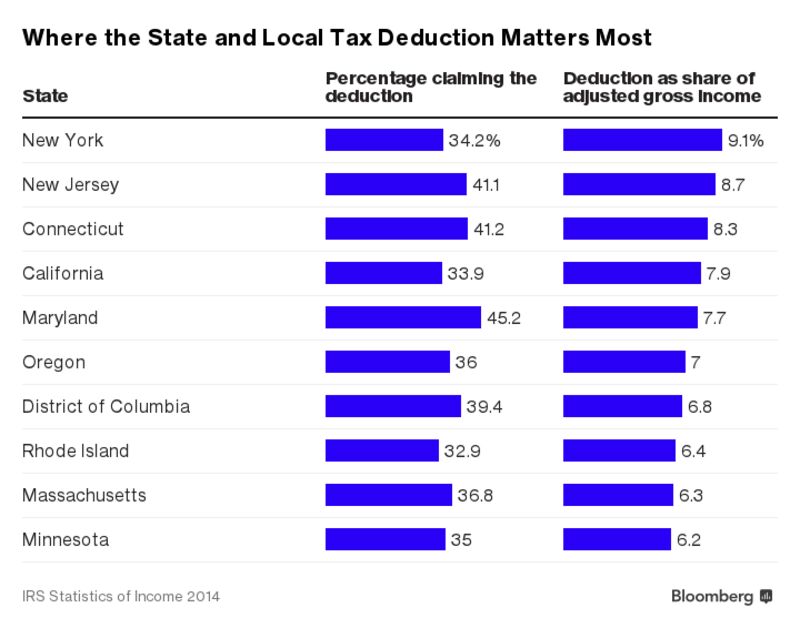
Wealthier Residents In Liberal States Are Biggest Beneficiaries Of Federal Tax Deduction For State And Local Taxes: Are Wealthy Liberals Willing To Support Elimination Of A Tax Loophole That Mostly Affects Their Pockets?
From Bloomberg, "Trump’s Tax Plan Could Be Painful for New York, New Jersey, and California: Wealthier residents of high-tax states would be especially hard hit if they can no longer deduct state and local taxes from their federal taxes." by Suzanne Woolley and Ben Steverman:
About 28 percent of tax filers claim the state and local deduction each year, according to the Tax Foundation. Of those, 77 percent deduct income taxes and the rest deduct sales taxes. The deduction ends up being far more valuable in states with the highest tax burdens.
Source: Bloomberg
Nationwide, wealthier taxpayers benefit the most from the deduction. More than 88 percent of its benefits go to Americans who earn more than $100,000 a year, according to the Tax Foundation.
Eliminating the deduction would boost federal tax collections by $1.8 trillion over the coming 10 years, the foundation calculated last month.

Thursday, April 27, 2017
Without The Inclusion Of Average Hours Worked And Worker Output, CBO's Comparison Of Public Vs Private Sector Compensation Is Meaningless
My posted comment to the Wall Street Journal opinion, "The Permanent Boomtown For federal workers, the deal keeps getting sweeter." by James Freeman about the recent CBO report, "Comparing the Compensation of Federal and Private-Sector Employees, 2011 to 2015:"
From The Wall Street Journal opinion:
From The Wall Street Journal opinion:
Not only are America’s 2.2 million civilian federal employees making more than their counterparts in the private market; the compensation gap is widening between the feds and the taxpaying public they allegedly serve. A new report from the Congressional Budget Office released this week finds that “the federal government paid 17 percent more in total compensation than it would have if average compensation had been comparable with that in the private sector.” At every level of education from a high school diploma or less through a master’s degree, workers made more off the taxpayers than similar workers made while toiling away in the real economy. The one exception: private-sector workers with a professional degree or doctorate have managed to achieve higher compensation than the government gang.My posted WSJ comment:
Comparing public versus private compensation without comparing worker output is meaningless. In the private sector, the concern for profitability pushes workers to be more productive. Public workers are rarely under any deadlines. The 17 percent number is probably lower than reality. If it takes three government workers to do the work of two private sector workers, then it is costing the government an additional 33 percent in extra pay and benefits in addition to the average 17 percent CBO found. It makes sense that CBO found that private professional and doctorate degree workers are paid more than public workers. This group probably has the highest percentage of no overtime pay. These private workers are likely producing more by working later, taking work home, working on weekends and delaying vacations more than government workers and are paid a premium for their extra productivity. CBO should include average weekly hours worked and output next time to have a meaningful comparison.
Monday, April 24, 2017
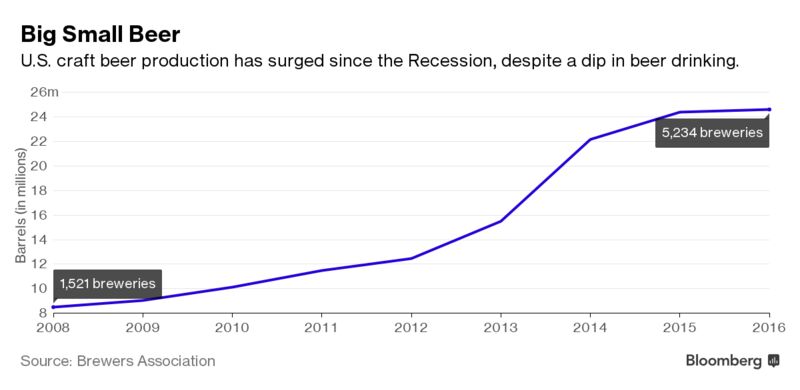
US Craft Beer Production Increasing Since Recesssion: Chart
From Bloomberg, "Beer Can Rigs Are Rescuing America’s Craftiest Brews: Mobile canners help small brewers thrive while fueling a beer-drinking renaissance." by Kyle Stock:***
In the beer world, small is slowly and steadily beating big, thanks in large part to a few dozen nomadic canning operations. Charging by the can, this burgeoning industry helps hundreds of brewing startups connect with customers without buying expensive machinery they don’t have the money or space for. As a result, an increasing number of the 5,300 breweries in America today can thrive—or at least survive.
 |
| Source: Bloomberg |
Friday, April 21, 2017
HUD Tells Wealthy Surburban Westchester County That Having Single Family Residential Areas Is Discrimination Against Minorities: County Should Allow More Multi-Family (Apartment) Buildings
The following letter from HUD to Westchester County represents everything that is wrong with HUD and US housing policy.
In the HUD letter, the first two towns mentioned are Pound Ridge and Larchmont.
Pound Ridge has about 5200 people, about 1850 households, a median HH income of about $190,000 and a median home price of over $850,000.
Larchmont has about 6100 people, about 2300 households, a median HH income of about $150,000 and a median home price of over $1 million.
HUD Lettter excerpts:--- To HUD, it seems, being richer than the poor and living in a residential community of expensive single family homes is discriminatory.
It gets funnier (or sadder). Pound Ridge does not have sewers (homes use septic systems), a nearby commuter railroad to NYC, or other public transportation. It is one of the towns that is a signer of the EPA and DEC approved NYC Watershed Compact, which protects NYC water reservoir sources. The agreement restricts development and increases in impervious surfaces because it will increase runoff and the presence of not easily filtered pollutants (e.g., salt) into NYC water. Pound Ridge and private developers are limited by law and agreement in pursuing further development of land.
In perspective, many Westchester towns have a population equal to one or two Manhattan NYC square blocks with high-rise apartment, co-op or condo buildings. Can you imagine HUD coming into NYC and telling it that certain square blocks on the upper East Side or upper West Side of Manhattan, along Central Park West or Fifth Avenue, were discriminatory because the tenant mix of each expensive rental, co-op, or condo building did not match the national average of minorities without any showing that a member of a minority with the financial means to afford the high cost was rejected? That is about the equivalent of what HUD is saying to Westchester County.
In the HUD letter, the first two towns mentioned are Pound Ridge and Larchmont.
Pound Ridge has about 5200 people, about 1850 households, a median HH income of about $190,000 and a median home price of over $850,000.
Larchmont has about 6100 people, about 2300 households, a median HH income of about $150,000 and a median home price of over $1 million.
HUD Lettter excerpts:
Kevin I. Plunkett
Deputy County Executive
Westchester County
148 Martine Avenue, 9th Floor
White Plains, NY 10601
Re: United States ex rel. Anti-Discrimination Center v. Westchester County
06 civ. 2860 (DLC) Zoning Analysis
Dear Mr. Plunkett:
The US. Department of Housing and Urban Development has received your March 20, 2017 submission entitled "Westchester County Analysis of Impediments Supplement to Chapter 12 Zoning Analysis" ("AI Supplement"). HUD has reviewed the Al Supplement and determined that it is unacceptable because it continues to lack appropriate analyses of impediments to fair housing choice and fails to identify forward-looking strategies to overcome those impediments.*** a. Failure to Address Segregation of White Residents
The AI Supplement focuses on "concentration" of minority residents but fails to analyze areas of white segregation. The discussion regarding Larchmont illustrates the problem. Nearly half of the acreage in the Village is dedicated to "high-density single~family" housing, while only 8% is dedicated to multifamily housing. Almost all of - 90% of the Village's acres is zoned for single family residential use and has an African American population of less than 1%. This indicates that African American residents are barely represented while white residents are overwhelmingly represented. Yet, the County fails to analyze whether zoning is a factor. [Footnote omitted.]
The analysis of Pound Ridge suffers from the same narrow focus. See pages 3-60 - 64. Pound Ridge does not allow any multifamily development as of right and there are only 17 multifamily units in the Town. Pound Ridge is 93.7% white and the housing stock is 99.2%
single-family. The AI Supplement concludes that there are no concentrations of African American or Hispanic residents and, therefore, the "zoning provisions are not posing as a barrier to diversification." Page 3-63. This conclusion is highly suspect. The concentration of white residents and the impact of limited multifamily development in Pound Ridge should have been addressed.
*** Conclusion
HUD finds that the Al Supplement is unacceptable and that the AI, therefore, does not satisfy the Settlement. HUD recognizes that the County will be unable to correct the above-described deficiencies in time to meet the Court's April 10, 2017 deadline to produce an AI that is acceptable to HUD. As such, notwithstanding the long history related to this litigation, HUD would not oppose a reasonable extension should the County seek one from the Court.
Sincerely,
Jay Golden
Regional Director
Office of Fair Housing and Equal Opportunity
It gets funnier (or sadder). Pound Ridge does not have sewers (homes use septic systems), a nearby commuter railroad to NYC, or other public transportation. It is one of the towns that is a signer of the EPA and DEC approved NYC Watershed Compact, which protects NYC water reservoir sources. The agreement restricts development and increases in impervious surfaces because it will increase runoff and the presence of not easily filtered pollutants (e.g., salt) into NYC water. Pound Ridge and private developers are limited by law and agreement in pursuing further development of land.
In perspective, many Westchester towns have a population equal to one or two Manhattan NYC square blocks with high-rise apartment, co-op or condo buildings. Can you imagine HUD coming into NYC and telling it that certain square blocks on the upper East Side or upper West Side of Manhattan, along Central Park West or Fifth Avenue, were discriminatory because the tenant mix of each expensive rental, co-op, or condo building did not match the national average of minorities without any showing that a member of a minority with the financial means to afford the high cost was rejected? That is about the equivalent of what HUD is saying to Westchester County.
Tuesday, April 18, 2017
Reprint Of A 7 Year Old Blog Post "Will Health Care Reform Be Legislative Vaporware?"
Below is a reprint of an over 7 year old blog post by me on December 20, 2009, "Will Health Care Reform Be Legislative Vaporware?"
The post below discussed the distinction between the passage of a well-intentioned health care law and the final desired health care benefits. Too often the media, politicians and the public act as if a law's passage and enactment is the end goal. They forget that a law is an intermediate step that sets in motion many agents to achieve the desired result. Until a law is implemented and running for several years, there is tremendous uncertainty as to the law's ability to achieve the original intended result, especially for such a large undertalking as reforming health care.
The post below discussed the distinction between the passage of a well-intentioned health care law and the final desired health care benefits. Too often the media, politicians and the public act as if a law's passage and enactment is the end goal. They forget that a law is an intermediate step that sets in motion many agents to achieve the desired result. Until a law is implemented and running for several years, there is tremendous uncertainty as to the law's ability to achieve the original intended result, especially for such a large undertalking as reforming health care.
Sunday, December 20, 2009
Will Health Care Reform Be Legislative Vaporware?
Posted By Milton Recht
Vaporware, a term from the computer industry where software companies announce their forthcoming release of new beneficial software that never materializes, appropriately applies to health care reform legislation
Congress will pass and the President will sign a health care reform law, but will it accomplish its many goals and have the many promised health care benefits or will it become a law that does not achieve its intended results? Could it actually make the machinery of our health care system function more poorly?
We must not forget that the benefit of this product called "health care" is the outcome to the patient and not its costs or insurability.
Many of us treat a law, such as whatever will pass for health care reform, as a final delivered product with all the previously promised beneficial features. Health reform requires more than the passage of a law called health reform. It requires accomplishing and solving many difficult and not well-understood health care issues.
Many laws are simple in that they do not involve modifying the process of an entire sector of the US economy. Most laws are categorizations that add to or remove from existing processes. A law that declares an action criminal, a felony, a higher fine, a health hazard, taxable, etc. and by declaration adds or subtracts from an existing framework easily achieves its intended results because the passage of the law itself achieves the results.
The well intended passage (and I give Congress and the President the benefit of the doubt that their actions are well intended) of a law in an area as large, as complex and as intertwined as health care requires more than enactment for achieving its original goals. It requires much more than a declaration of Congressional wishes and a redefinition of health care, health insurance, uninsured, etc.
Until any health care law is fully functioning, there is a lot of uncertainty as to its effectiveness, no matter how well intentioned. In the health care debate, our upset was with process and costs, but not outcomes. We never heard that doctors were doing appendectomies wrong or that too many patients with appendicitis died. We heard that appendectomies cost too much out of pocket or that someone could not or did not get affordable insurance to cover the needed medical care.
What we do not yet understand about any health care reform law that passes Congress is how that law will affect health outcomes. It is quite possible, and likely, that any health law making as much of a change to health insurance and health care as will likely pass Congress, will also likely affect delivery and choices of treatment, doctor availability, and health outcomes.
Whether the law will lower costs, decrease the number of uninsured and improve health outcomes is unknown until medicine functions for some time under the new legislation. While many will say it is in any case a first step toward improved health care outcomes, increased insurance availability and lowered costs, and that Congress will modify it as needed, a poorly laid foundation will never result in a quality home. [Emphasis not in original.]
To me, health care reform legislative passage is vaporware. It is solely a promise of beneficial outcomes and intended benefits. Until, the law is functioning for a few years, after all its provisions take effect, will I and the rest of the US know whether a real, functioning, improved, lower cost health care system exists. Until such time, passage of the law is merely an announcement of intended benefits. It is vaporware.
Posted 12/20/2009 04:53:00 AM
Sunday, April 16, 2017
Over The Last 3 Years, Investors Put 8.5 Times As Much Money In Vanguard As In The Rest of The Mutual Fund Industry: $823 Billion Vs $97 Billion
From The New York Times, "Vanguard Is Growing Faster Than Everybody Else Combined" by Landon Thomas Jr.:
In the last three calendar years, investors sank $823 billion into Vanguard funds, the company says. The scale of that inflow becomes clear when it is compared with the rest of the mutual fund industry — more than 4,000 firms in total. All of them combined took in just a net $97 billion during that period, Morningstar data shows. Vanguard, in other words, scooped up about 8.5 times as much money as all of its competitors.
*** The triumph of index fund investing means Vanguard’s traders funnel as much as $2 billion a day into stocks like Apple, Microsoft and Amazon, as well as thousands of smaller companies that the firm’s fleet of funds track. That is 20 times the amount that Vanguard was investing on a daily basis in 2009. It is manageable, in large part, because no stock-picking is involved: The money simply flows into index funds and E.T.F.s, and through February of this year, nine out of every 10 dollars invested in a United States mutual fund or E.T.F. was absorbed by Vanguard.
By any measure, these are staggering figures. Vanguard’s assets under management have skyrocketed to $4.2 trillion from $1 trillion seven years ago, according to the company. About $3 trillion of this is invested in passive index-based strategies, with the rest in funds that rely on an active approach to picking stocks and bonds.
Subscribe to:
Posts (Atom)