Minimum Wage by State
State 2016 2017 2018 2019 2020 2021 2022 Oregon $9.75 $10.25 $10.75 $11.25 $12.00 $12.75 $13.50 District of Columbia $11.50 $11.74 $12.01 $12.29 $12.58 $12.88 $13.19 Vermont $9.60 $10.00 $10.50 $10.75 $11.01 $11.27 $11.54 Alaska $9.75 $9.95 $10.18 $10.41 $10.66 $10.92 $11.18 Massachusetts $10.00 $11.00 $11.00 $11.00 $11.00 $11.00 $11.00 Washington $9.47 $9.67 $9.89 $10.12 $10.36 $10.61 $10.86 Minnesota $9.00 $9.50 $9.72 $9.94 $10.18 $10.42 $10.67 Michigan $8.50 $8.90 $9.25 $9.46 $9.69 $9.92 $10.16 Connecticut $9.60 $10.10 $10.10 $10.10 $10.10 $10.10 $10.10 Maryland $8.75 $9.25 $10.10 $10.10 $10.10 $10.10 $10.10 Hawaii $8.50 $9.25 $10.10 $10.10 $10.10 $10.10 $10.10 California $10.00 $10.00 $10.00 $10.00 $10.00 $10.00 $10.00 South Dakota $8.55 $8.75 $8.95 $9.15 $9.35 $9.55 $9.80 New Jersey $8.38 $8.56 $8.76 $8.96 $9.18 $9.40 $9.63 Rhode Island $9.60 $9.60 $9.60 $9.60 $9.60 $9.60 $9.60 Colorado $8.31 $8.48 $8.68 $8.88 $9.09 $9.31 $9.53 Ohio $8.10 $8.25 $8.45 $8.65 $8.85 $9.05 $9.25 Florida $8.05 $8.22 $8.41 $8.60 $8.81 $9.02 $9.24 Montana $8.05 $8.20 $8.40 $8.60 $8.80 $9.00 $9.20 Arizona $8.05 $8.20 $8.40 $8.60 $8.80 $9.00 $9.20 New York $9.00 $9.00 $9.00 $9.00 $9.00 $9.00 $9.00 Nebraska $9.00 $9.00 $9.00 $9.00 $9.00 $9.00 $9.00 Missouri $7.65 $7.80 $8.00 $8.20 $8.40 $8.60 $8.80 West Virginia $8.75 $8.75 $8.75 $8.75 $8.75 $8.75 $8.75 Arkansas $8.00 $8.50 $8.50 $8.50 $8.50 $8.50 $8.50 Illinois $8.25 $8.25 $8.25 $8.25 $8.25 $8.25 $8.25 Delaware $8.25 $8.25 $8.25 $8.25 $8.25 $8.25 $8.25 Nevada $8.25 $8.25 $8.25 $8.25 $8.25 $8.25 $8.25 Maine $7.50 $7.50 $7.50 $7.50 $7.50 $7.50 $7.50 New Mexico $7.50 $7.50 $7.50 $7.50 $7.50 $7.50 $7.50 Federal Minimum $7.25 $7.25 $7.25 $7.25 $7.25 $7.25 $7.25 New Hampshire $7.25 $7.25 $7.25 $7.25 $7.25 $7.25 $7.25 Pennsylvania $7.25 $7.25 $7.25 $7.25 $7.25 $7.25 $7.25 Indiana $7.25 $7.25 $7.25 $7.25 $7.25 $7.25 $7.25 Wisconsin $7.25 $7.25 $7.25 $7.25 $7.25 $7.25 $7.25 Iowa $7.25 $7.25 $7.25 $7.25 $7.25 $7.25 $7.25 North Dakota $7.25 $7.25 $7.25 $7.25 $7.25 $7.25 $7.25 Kansas $7.25 $7.25 $7.25 $7.25 $7.25 $7.25 $7.25 Virginia $7.25 $7.25 $7.25 $7.25 $7.25 $7.25 $7.25 North Carolina $7.25 $7.25 $7.25 $7.25 $7.25 $7.25 $7.25 South Carolina $7.25 $7.25 $7.25 $7.25 $7.25 $7.25 $7.25 Georgia $7.25 $7.25 $7.25 $7.25 $7.25 $7.25 $7.25 Kentucky $7.25 $7.25 $7.25 $7.25 $7.25 $7.25 $7.25 Tennessee $7.25 $7.25 $7.25 $7.25 $7.25 $7.25 $7.25 Alabama $7.25 $7.25 $7.25 $7.25 $7.25 $7.25 $7.25 Mississippi $7.25 $7.25 $7.25 $7.25 $7.25 $7.25 $7.25 Louisiana $7.25 $7.25 $7.25 $7.25 $7.25 $7.25 $7.25 Oklahoma $7.25 $7.25 $7.25 $7.25 $7.25 $7.25 $7.25 Texas $7.25 $7.25 $7.25 $7.25 $7.25 $7.25 $7.25 Idaho $7.25 $7.25 $7.25 $7.25 $7.25 $7.25 $7.25 Wyoming $7.25 $7.25 $7.25 $7.25 $7.25 $7.25 $7.25 Utah $7.25 $7.25 $7.25 $7.25 $7.25 $7.25 $7.25
Oregon rate reflects state's base wage. Portland metro area will be higher, rural areas lower. Future rates in 15 states and the District of Columbia are tied to cost-of-living changes and based on inflation estimates.
Economic Policy InstituteSource: The Wall Street Journal
Monday, March 28, 2016
State Minimum Wage Chart: Wall St Journal
From The Wall Street Journal, Real Time Economics, "Analysts React to California’s Proposed $15 Minimum Wage: ‘A Blunt Approach’ " by Eric Morath, sorted by 2022 wage, highest to lowest:
Minimum Wage by State
Source: The Wall Street Journal

Tuesday, March 22, 2016
US Men Have 2-Year Shorter Life Expectancy Due To Higher Rate Of Death From Injuries Than Men In Other High-Income Countries
From ScienceNews, "Three big reasons why U.S. men have a shorter life expectancy" by Meghan Rosen:
Source: ScienceNews
Guns, drugs, cars. Sounds like a formula for an action movie, but the list may explain why American men don’t live as long as men in other high-income countries.
In the United States, average life expectancy among men is 76.4 years — about two years shorter than men who live in Germany, Sweden, the United Kingdom and nine other countries. Deaths due to injuries are the reason for much of the gap, researchers report in the Feb. 9 JAMA.

Monday, March 21, 2016
Local Government Debt As Share Of US GDP: 1977 To 2012 Graph
From Manhattan Institute, City Journal, "Caesarism for Cities: To prevent more Detroits, states must rein in local officials’ fiscal recklessness." by Stephen Eide, Winter 2016:
Local governments’ total outstanding debt stood at $1.8 trillion in 2013, the most recent year for which Census Bureau data are available. Expressed as a share of national GDP (11 percent), this sum is down slightly from its 2009–11 peak but still higher than at any other time going back at least 35 years. Cities’ retirement-benefits burden has been worsening rapidly. In a study published in January 2015, Stanford University’s Joshua Rauh found that ten large U.S. cities’ pension liabilities had grown by 40 percent since the end of the Great Recession—from $277 billion to $359 billion—despite 75 percent growth in equity values from 2009 to 2013 and a wave of pension-reform legislation. (See "Scary Pension Math.") These elevated pension and bonded-debt figures suggest that the threat of municipal insolvency is greater than at any time since the Great Depression.
Compounding the problem of many cities’ extensive liabilities are relatively weak revenue bases. Nearly eight years after the last recession began, city revenues nationwide still have not returned to 2006 levels, according to a recent National League of Cities study.***
Source: Manhattan Institute City Journal

Thursday, March 10, 2016
Consumers Will Trade Product Design, But Not Product Function, For Environmental Friendliness
From "Is it earth-friendly? Study shows consumers think beyond form and function" on SclenceBlog:
That study reveals that customers are willing to trade esthetic values — how good the design looks — for environmental friendliness, but will not make the same bargain when it comes to how well the product functions.
"When you’re designing a product, you don’t want to give up functionality for the sake of altruistic value," [SF State Associate Professor of Marketing Minu] Kumar said. "But you can potentially invest a little more in altruism than esthetics and still get away with it."*** [STUDIES]
"Beyond form and function: why do consumers value product design?" by Kumar and Charles H. Noble was published online in 2015 in the Journal of Business Research and appears in the journal’s February 2016 issue. The research was funded by the Marketing Science Institute. "Yes, but this other one looks better/works better: how do consumers respond to trade-offs between sustainability and other valued attributes?" by Michael G. Luchs and Kumar was published online in 2015 in the Journal of Business Ethnics and will appear in a future print edition.
Tuesday, March 8, 2016
My Comment To WSJ Article, "$lammed by ObamaCare"
My comment to The Wall Street Journal, "$lammed by ObamaCare: My Bronze plan’s monthly premium jumped $194 this year. I never thought I’d look forward to Medicare, but I do now." by Christopher E. Press:
No one confuses auto insurance with automobiles, yet in medicine we confuse health insurance with medical care. The way to reduce the cost of healthcare is through medical care competition, and not through health insurance modifications and subsidies. Let doctors and hospitals freely compete including across states and the price of all medical and surgical procedures and doctor visits and examinations will significantly decline. Relax the restrictions on what RNs, physician assistants and pharmacists cannot do. Allow hospitals and mini-hospitals to open without a need to show community need first. Switch away from the price fixing caused by a diagnostic code insurance reimbursement system. With easier entry, with more purveyors of medical care and with competition for customers, without a reimbursement price list, the cost of health care will decline rapidly, become affordable and its quality will significantly improve.
Tuesday, March 1, 2016
Value Of Earned Income Tax Credit, Adjusted For Cost Of Living, In US Cities
From The Wall Street Journal, Real Time Economics, "The Earned Income Tax Credit Is Worth Far Less in San Francisco. Should We Fix That?" by Nick Timiraos:
The local cost of living, however, also dramatically influences the value of the [earned income tax] credit and the share of taxpayers that benefit. After adjusting for local living-cost differences, the maximum value of the EITC ranges from nearly $4,000 for a single taxpayer with one child in Memphis, Tenn., to nearly $2,100 in San Francisco and $1,500 in Manhattan.
Source: The Wall Street Journal, Real Time Economics

Most Liberal US States
From The New York Times, TheUpShot, "Why Liberal Massachusetts Is Poised to Give Donald Trump a Big Victory" by Toni Monkovic:
The Most Liberal States
Percentage of residents in each state identifying as liberal.
30.329.829.627.627.527.527.426.926.725.5

Nonprofit Employment, Annual Wages And Establishments Increased Every Year, From 2007 through 2012, Including 2007-9 Recession
From US Bureau of Labor Statistics, Monthly Labor Review, February 2016, "Nonprofits in America: new research data on employment, wages, and establishments" by Erik Friesenhahn, Office of Employment and Unemployment Statistics, US Bureau of Labor Statistics:
Nonprofit employment, total annual wages, and the number of establishments grew steadily each year from 2007 through 2012. Over this period, nonprofit employment increased 8.5 percent, from 10.5 million jobs to 11.4 million jobs. Nonprofit employment increased every year during the 2007–12 review period, even during the 2007–09 recession. Total annual wages (not adjusted for inflation) increased from $421 billion in 2007 to $532 billion in 2012, a nominal increase of 26 percent. During this same period, the number of nonprofit establishments increased 15 percent, from 232,396 to 267,855. (See table 1.)
[table 1 omitted.]
In contrast to the steady growth that the nonprofit sector experienced, the total private sector employment, total annual wages, and the number of business establishments varied more with economic fluctuations. All three data series exhibited highly cyclical movements during the 2007–09 recession and the subsequent recovery.
Friday, February 26, 2016
Hey Democrats: Equal Pay For Equal Work Hurts Women And Removes Employers' Costs Of Gender Employment Discrimination: Milton Friedman Video - 'Case Against Equal Pay for Equal Work'
Additonally, see my Thursday, October 1, 2015, blog post, "Women Make Different Work Choices Than Men: My Comment To Wall Street Journal Wage Gap Myth Commentary" and my Thursday, April 9, 2015, blog post, "My Slashdot Comment To Ellen Pao Salary Negotiation Ban To Equalize Gender Pay At Reddit."
Tuesday, February 23, 2016
Education Level Continues To Explain Differences In US Unemployment Rates
From The Wall Street Journal, "The January Jobs Report in 12 Charts" by Nick Timiraos and Josh Zumbrun:
The unemployment rate for college graduates has remained far lower than for those with some college or only a high school diploma. Those with less than a high school education face the highest unemployment rates.Many studies, reports and news articles about unemployment and race fail to take into account and adjust for education level differences among the various ethic and racial groups, including the recent Education Policy Institute, "State unemployment rates by race and ethnicity at the end of 2015 show a plodding recovery" by Valerie Wilson, and the recent Wall Street Journal article, "Black Workers in Many States Haven’t Seen Much of a Recovery, Analysis Suggests" by Kate Davidson.
Source: The Wall Street Journal, Real Time Economics

Saturday, February 20, 2016
First Generation College Students Dropout Of School At 3 Times The Rate Of Students Who Have College Educated Parents: Dropouts Account For Increase In Financial Problems Paying Student Loans
From The New York Times, The Upshot, Economic View, "How to Help More College Students Graduate" by Susan Dynarski:
The financial prospects for college dropouts are poor, for two reasons. First, dropouts earn little more than people with no college education. Second, many dropouts have taken on student loans, and with their low wages, they have difficulty paying off even small balances. Dropouts account for much of the increase in financial distress among student borrowers since the Great Recession.
The dropout problem is particularly acute for students whose parents did not attend college. First-generation students beat enormous odds by even enrolling in a four-year degree program. Yet 30 percent of first-generation freshmen drop out of school within three years. That is three times the dropout rate of students whose parents graduated from college.
Why is the dropout rate so high, particularly among first-generation students? The consensus among researchers is that there is no single culprit — and, therefore, no silver bullet. First-generation students tend to have less money, have weaker academic preparation and attend colleges with fewer instructional resources. All of these have been shown to increase the likelihood of dropping out.
Critically, first-generation students also miss out on the advice, support and voice of experience provided by parents with firsthand experience of higher education. There is only so much information that overburdened guidance counselors can cram into students during a few short meetings.
Thursday, February 18, 2016
2015 Participation In Earning From Gig Economy Is 10 Times 2012 Participation Level
From The Wall Street Journal, Real Time Economics, "Gig Economy Attracts Many Workers, Few Full-Time Jobs" by Eric Morath:
Nearly 1% of U.S. adults earned income in September 2015 via one of the growing number of firms that are part of the sharing or gig economy, according to a study of bank transactions by the JPMorgan Chase Institute, released Thursday. Participation has exploded since October 2012, when just 0.1% of adults were paid by such platforms.
Source: The Wall Street Journal
***
Source: The Wall Street Journal


Sunday, February 14, 2016
Four Billion People Face Fresh Water Scarcity At Least One Month A Year
From The Christian Science Monitor, "Fresh water crisis: Four billion people face water scarcity, says study: Scientists from the Netherlands suggest four billion people face water scarcity, twice the number previously expected. But the authors say this accurate assessment is important, because it sets the stage for real progress." by Story Hinckley:
Fresh water on Earth is scarce and getting scarcer – we know that. In 2015 the World Economic Forum ranked "water crises" as the top risk facing the planet.
But authors of a recent report published Friday in the journal Science Advances say previous studies have underestimated the severity of water scarcity around the world. Instead of impacting around two billion people as researchers previously suggested, it’s more along the lines of four billion, say Dr. Mesfin Mekonnen and Dr. Arjen Hoekstra at the University of Twente in Enschede, Netherlands.*** "Most of the previous water scarcity studies are done on an annual basis, which hides the actual variability within a year," co-author Dr. Mekonnen, a postdoctoral researcher at the University of Twente, tells The Christian Science Monitor in an email Thursday. To understand water scarcity on the global level, Mekonnen and Hoekstra assessed local "blue water scarcity," or the amount of freshwater that is withdrawn and not returned, on a monthly level.
But these four billion people are not facing water scarcity all year round, notes Mekonnen, instead it’s more along the lines of one month a year.
Friday, February 12, 2016
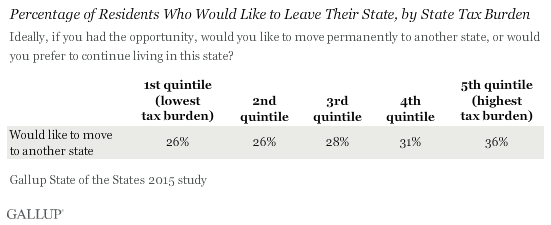
Residents In Higher Tax Burden States Most Likely To Want To Leave State
From Gallup, "In U.S., State Tax Burden Linked to Desire to Leave State" by Stephanie Marken and Zac Auter:
Residents living in states with the highest aggregated state tax burden are the most likely to report they would like to leave their state if they had the opportunity. Connecticut and New Jersey lead in the percentage of residents who would like to leave their state.
Source: Gallup
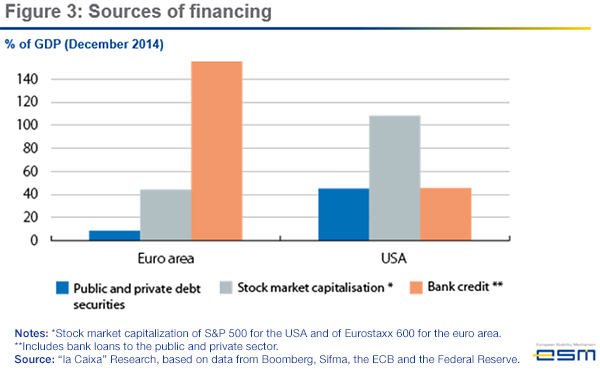
European Banks Have 3 Times The Assets Of US Banks: Securities Industry Is Main Source Of US Business Financing: Banks Are Main Source Of Euro Area Business Financing
While Europe is trying to increase business funding from equity and debt capital markets, venture capital, private equity, and IPOs, and emulate the US, many in the US Congress, several US Presidential candidates and many in the media are attacking the securities industry and want to see its financing role diminished and more heavily regulated.
From Knowledge@Wharton, Opinion Piece, "Europe’s Financial Reforms: What Are the Next Big Changes?" by Kalin Anev Janse, secretary general and member of the management board of the European Stability Mechanism:
From Knowledge@Wharton, Opinion Piece, "Europe’s Financial Reforms: What Are the Next Big Changes?" by Kalin Anev Janse, secretary general and member of the management board of the European Stability Mechanism:
Big Topic 2: The World Is About to Change for Market Players – Capital Markets Union
While the banking union is advancing at rapid speed, Europe also launched another big project last year: the capital markets union (CMU). The CMU’s goal is to create deeper and more integrated capital markets. Traditionally, Europe has been dominated by bank financing: When an entrepreneur needed funding, banks were the go-to partner. During the crisis, banks tried to reduce their risk exposure and, as a result, financing for entrepreneurs, small- and medium-sized enterprises (SMEs) and some corporations dried up. The CMU aims to address this issue.
The differences on the two sides of the Atlantic Ocean are large. Banking union bank assets
Source: Knowledge@Wharton
total $33.2 trillion compared to just $13.4 trillion in the U.S. (figure 2), a gap explained by the source of financing (figure 3). Euro area banking credit reaches some 170% of GDP, but in the U.S., just 45% of GDP. Stock market capitalization and debt securities are respectively some 45% and 10% of GDP in the euro area and 110% and 45% in the U.S.
Source: Knowledge@Wharton

Tuesday, February 9, 2016
Lower US Life Expectancy Caused By Excessive Drug Overdoses, Auto Crashes, And Gun Violence Compared To Developed Countries: Not Caused By Healthcare Differences
From BloombergBusiness, "Guns, Drugs, and Car Crashes: Why Americans Die Younger: Three paths to death explain much of the life expectancy gap between the U.S. and other wealthy nations." by John Tozzi:
See my similar post from March 4, 2011, "Life Expectancy Versus Medical Costs Charts Are Often Wrong."
The average American will die as many as two years sooner than if they lived in Western Europe or Japan. This can be attributed, in part, to three of the darker elements of life in the U.S.: gun violence, drug overdoses, and death on the road.
More than 100,000 people in the U.S. lose their lives as a result of these causes every year. For each of the categories, the death rate is far higher in America than in other wealthy countries, according to research published Tuesday in the Journal of the American Medical Association.
Source: BloombergBusiness
The disparity is evident in comparisons with each of the 12 developed countries that have comparable mortality data available. These include Austria, Denmark, Finland, Germany, Italy, Japan, the Netherlands, Norway, Portugal, Spain, Sweden, and the United Kingdom.
***
Source: BloombergBusiness


See my similar post from March 4, 2011, "Life Expectancy Versus Medical Costs Charts Are Often Wrong."
Girl Scouts Go OnlineTo Sell Cookies With 'Digital Cookie 2.0'
From The Girl Scouts website, "Digital Cookie 2.0 Is Here!"
So, how does Digital Cookie work?
It’s a lot like buying your cookies at a traditional cookie booth, but with an online twist:
- In true Girl Scout style, the girls initiate the cookie sale, whether online, via email, or in person at the cookie booth with their mobile app.
- A Girl Scout you know may invite you to visit her personalized cookie website where you can place your order, pay using Visa Checkout or credit cards, have your order shipped or delivered by a Girl Scout*, or even donate cookies to charity.
- Some Girl Scouts may take in-person orders using a mobile app that also allows them to securely accept payments using credit cards.
- Select your cookies, place your order, and complete your transaction. Boom, just like that, you’ve got yummy Girl Scout Cookies coming your way!
Friday, February 5, 2016
Top 28 Percent Of Income Earners Paid 55 Percent Of Total US Income Tax
From Tax Foundation, "New IRS Data: Wealthy Paid 55 Percent of Income Taxes in 2014" by Scott A. Hodge:
As the nearby chart shows, the wealthy’s tax burden is considerably larger than their share of the nation’s income. High-income taxpayers earned 28 percent of total adjusted gross (AGI) income in 2014 while paying 55 percent of the entire income tax burden. By contrast, the remaining 145 million taxpayers command 72 percent of the nation’s income, but paid a combined total of 45 percent of all income taxes.
Source: Tax Foundation

29 Percent Of Obese Adults, 16 Percent Of Severely Obese, Are Metabolically Healthy: 30 Percent Of Normal-Weight Americans Are Metabolically Unhealthy
From National Institutes of Health, US National Library of Medicine, "'Obese' May Not Always Equal Unhealthy: Study: Authors warn against using body size as sole measure of good health, but other experts cite risks of too much weight:"
Using a government health survey, researchers found that nearly half of overweight U.S. adults were "metabolically healthy."
That meant they had no more than one risk factor for type 2 diabetes and heart disease -- including high blood pressure, unhealthy cholesterol or triglyceride levels, elevated blood sugar, or high concentrations of C-reactive protein (a marker of inflammation in the blood vessels).
Among obese adults, 29 percent were deemed healthy -- as were 16 percent of those who were severely obese based on body mass index (BMI, a ratio of weight to height).
On the other hand, more than 30 percent of normal-weight Americans were metabolically unhealthy.
Politicians Protect Their Big Business Donors From Competition Through Regulations That Create Barriers To Entry Under The Guise Of Protecting The Public
From The Wall Street Journal, Opinion, "Hillary’s Wall Street Reckoning: Clinton struggles to explain why Goldman paid her $675,000:"
The long-standing arrangement between Democrats and financial giants like Goldman is that the politicians collect money and get to pose as populists by publicly attacking the big banks, and in return the big banks enjoy high regulatory barriers that prevent smaller firms from competing with them. New York Sen. Chuck Schumer has perfected this bargain, which may have reached its zenith with the Dodd-Frank law of 2010, which brought Wall Street giants and Washington into a historically intimate embrace.
Yes, Wall Streeters love to complain about Dodd-Frank, but they also know it virtually ensures that no upstart finance company in the Midwest is going to challenge Goldman’s position in global finance. "More intense regulatory and technology requirements have raised the barriers to entry higher than at any other time in modern history," said Goldman CEO Lloyd Blankfein last year. "This is an expensive business to be in, if you don’t have the market share in scale."
*** But according to the Center for Responsive Politics, which maintains a searchable database of contributions reported to the Federal Election Commission, the securities and investment industry is Mrs. Clinton’s single greatest source of support. Financiers have given her campaign and other pro-Clinton political operations more than $17 million, compared with a little less than $78,000 for Mr. Sanders.
Thursday, February 4, 2016
CBO Presentation Slides On The 2016 To 2026 Economic Outlook And The 2016 To 2026 Budget Outlook
From Congressional Budget Office, "The Economic Outlook for 2016 to 2026 in 17 Slides" February 4, 2016 Report:
This presentation of the economic outlook for the coming decade highlights the key findings from CBO’s report The Budget and Economic Outlook: 2016 to 2026, which was released in January.From Congressional Budget Office, "The Budget Outlook for 2016 to 2026 in 19 Slides" February 4, 2016 Report:
This presentation of the budget outlook for the coming decade highlights the key findings from CBO’s report The Budget and Economic Outlook: 2016 to 2026, which was released in January.
Tuesday, February 2, 2016
15 Year Decline In Labor Force Participation Among Upper Income Half Households In Prime Working Years, 25-54 Year Olds
From Federal Reserve Bank of San Francisco, FRBSF Economic Letter 2016-02, February 1, 2016, "Changes in Labor Participation and Household Income" by Robert Hall and Nicolas Petrosky-Nadeau:
The percentage of people active in the labor force has dropped substantially over the past 15 years. Part of this decline appears to be the result of secular factors like the aging of the workforce. However, the participation rate among people in their prime working years—ages 25 to 54—has also fallen. Recent research suggests this decline among prime-age workers can be attributed in large part to lower participation from among the higher-income half of U.S. households.
*** The LFP [labor force participation] rate for people between the ages of 25 and 54 was 83.8% in 2004, then dropped to 81.2% by 2013. This 2.6 percentage point decline has persisted well beyond the end of the Great Recession and has caught the attention of policymakers, particularly because it concerns workers in their prime who are usually active participants in the labor market.
*** Table 1 Labor force participation among prime-age workers across household income distributions
Note: Numbers to right of lines show percentage point changes to total and quartile contributions, 2004–13.
Source: Federal Reserve Bank of San Francisco
Looking back in time, we see that the decline in the LFP rate of prime-age workers is unevenly spread across the income distribution. The poorest quartile had the smallest change since 2004, falling 0.8 percentage point. The second quartile fell 2.4 points, while the third quartile reported the largest drop with 3.2 points. Participation also fell 2.0 percentage points for households in the fourth quartile.
*** Figure 1 Changes in labor participation among prime-age workers Total and contribution by quartiles of household income distribution
Source: Federal Reserve Bank of San Francisco *** Figure 2 Contribution by age group to changes in labor participation
Source: Authors’ calculations based on the SIPP.
Source: Federal Reserve Bank of San Francisco


Monday, February 1, 2016
CDC Study Finds Teen Boys As Likely As Teen Girls To Be Victims Of Dating Violence
From MedlinePlus, "Boys Victims of Dating Violence, Too: Survey of 'at risk' teens finds males as likely as females to suffer abuse:"
Contrary to what many people may think, teenage boys commonly suffer dating violence -- including physical and emotional abuse, a new U.S. government [Centers for Disease Control and Prevention] study finds.
The study focused on teens considered to be at high risk for dating violence -- those who had suffered or witnessed violence at home or in their neighborhoods.
It turned out that boys were about as likely as girls to say they'd been victims of some form of dating violence. The pattern was also corroborated by girls' reports: They commonly admitted to being perpetrators.*** [Dennis Reidy, of the division of violence prevention at the U.S. Centers for Disease Control and Prevention] added, the study points out that boys can be victims, too. [Emphasis added.]
Subscribe to:
Posts (Atom)