Some people thought it [High Yield, aka Junk, Bond Market] was a sham, it's rigged. Now it's a trillion-dollar market. It's anything but a sham.
Source: BloombergBusiness
Thursday, December 31, 2015
High Yield Bond Market Since Milken And Drexel
From BloombergBusiness, "Renegades of Junk: The Rise and Fall of the Drexel Empire: The people who lived through Michael Milken's Wall Street saga tell it in their own words, 25 years later" by Max Abelson, Jason Kelly, and David Carey:


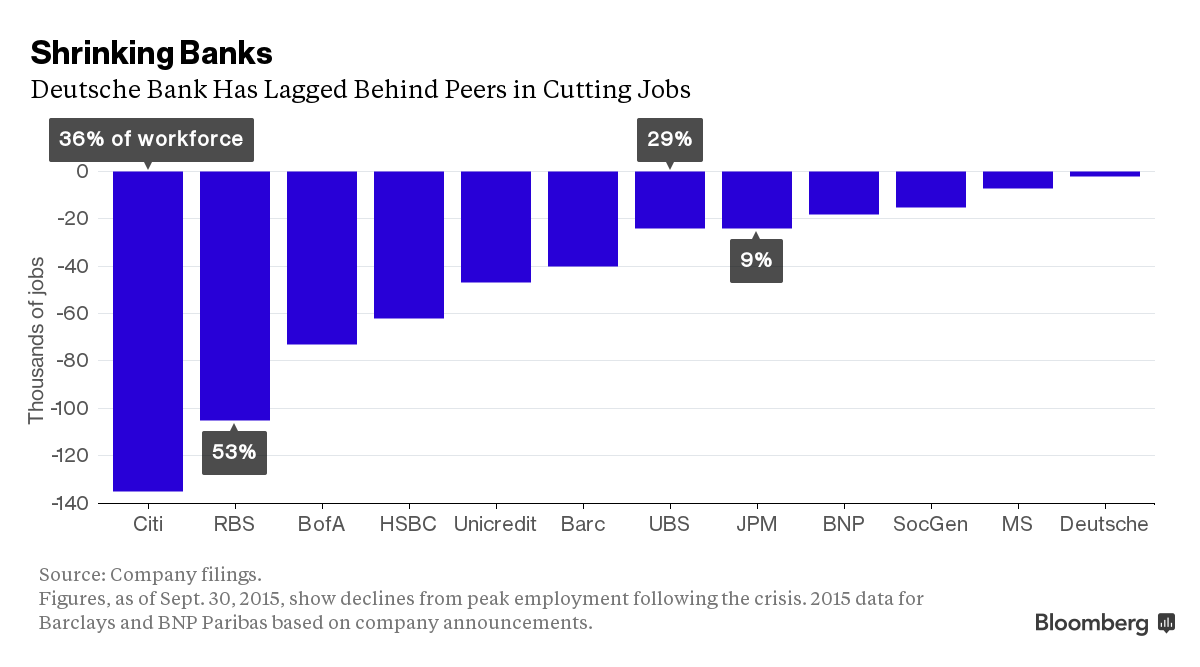
Banks Have Cut Over A Half Million Jobs Since 2008
From BloombergBusiness, "Half a Million Bank Jobs Have Vanished Since 2008 Crisis: Chart" by Yalman Onaran:
Source: BloombergBusiness
Announced cuts in the fourth quarter total at least 47,000, following 52,000 lost jobs in the first nine months of 2015. That would bring the aggregate figure since 2008 to about 600,000. UniCredit SpA says it will eliminate about 18,200 positions. Citigroup Inc., which has reduced its workforce by more than a third, plans to eliminate at least 2,000 more jobs next year.
Wednesday, December 30, 2015
Domestic US Net Migration Among States And Regions: The South Attracts The Most People From Other Regions: The Northeast Is Losing The Most People
From The Washington Post, "The states people really want to move to — and those they don’t" by Emily Badger and Darla Cameron:
Source: The Washington Post ***
Source: The Washington Post
Several long-term trends dating as far back as the 1960s are behind this larger pattern. The rise of air conditioning and interstate highways have made once-sleepy (and sweltering) Southern cities more appealing. And, over the same time, the decline of industrial jobs in the Midwest and Northeast have pushed people out. Cheap housing during the boom years also drove growth in states such as Arizona and Nevada.
For states like New York, domestic migration losses are offset by new immigration from abroad. But for many places in the Rust Belt, these shifts will mean more empty houses and "shrinking cities," and less political might.


Sunday, December 13, 2015
The Fairness Of Preferential Admissions To Colleges
A re-posting of a comment I wrote back in 2010 on opportunity and outcome fairness.
I do not think three people could agree on what "fairness" means.
In golf and horseracing, there is handicapping, which is an attempt to remove beginning advantages to give all an equal chance of winning.
In the US, philosophically, we want to believe that all groups are capable of the same results, i.e. the same percentage of doctors, lawyers, police officers, firefighters, millionaires, successful entrepreneurs, CEOs, college graduates, homeowners, etc.
If one believes handicapping is "fair" to undo socio-economic or competitive disadvantages, then group outcomes should be statistically equal. For these believers, unequal outcomes at the group level indicate ineffective handicapping. It indicates a need to improve the "fairness" of the handicapping process to produce equal outcomes.
If one believes, "equal treatment" [equal opportunity] does not allow for handicapping, does not include school admission preferences, affirmative job action, remedial help, extra time on tests, etc., then equal outcomes will not occur because family socio-economic status predicts many of the outcomes and groups sort by socio-economic status in the US.
Different people can disagree whether "fairness" of equal treatment includes "handicapping".
[Subgroup Versus Whole Group Preferential Treatment And Outcomes]
There is also often a failure to distinguish the characteristics of the subgroup at the hiring or acceptance level from the characteristics of the whole group, and we often focus on subgroup "fairness" in place of group "fairness".
For example, suppose two groups, A and B, are very similar, except the top ten percent of Group A want to become lawyers and the top ten percent of Group B want to become doctors. What is a fair outcome at the top medical schools and top law schools?
By measurements of skills, test scores, grades, etc, we should expect more Group A's to be admitted to top law schools than Group B's. Additionally, we should expect more Group B's to be admitted to top medical schools than Group A's. Should medical and law schools allow the disparate outcome or should they equalize their admission rates for Groups A and B?
Different religions, race, country of origin, socio-economic status etc. groups rank careers and other aspirations differently and those rankings within the groups will sort each group differently. If one group ranks firefighting as a career over retail store management and the other group ranks retail store management higher, is it fair to want each job category to contain the same percentage of each group? Are the gate keeping tests and hiring processes that result in different outcomes "unfair" when group career preferences differ? Is it "unfair" if different career choices have different total life earnings effects?
Saturday, December 12, 2015
Post Recession UK Employment Rates Higher After British Austerity Than US Employment Rates After US Healthcare Reform
From supply and demand (in that order), "Fiscal Policies and the Prices of Labor: A Comparison of the U.S. and the U.K." by Casey B Mulligan:
Many countries of the world experienced an unusually deep and long recession after 2007. Over the same time frame, several facets of fiscal policy were changed, especially policies related to taxation and safety net programs. The purpose of this paper is to compare changes in fiscal policy parameters as they affected the incentives of middle-class Americans and British to be employed. The U.K. had a "stimulus programme" followed by an "austerity programme." The U.S. federal government also passed what it called a "stimulus package," followed by a major health reform.*** The evolution of employment has also been different in the two countries. Figure 1 displays an index of each country’s employment rates for prime-aged people. Employment fell sharply in both countries during the crisis, although less so in the U.K. The U.K. employment recovery began earlier, and by the end of 2014 the U.K. employment rate had exceeded pre-crisis levels.***
Source: supply and demand (in that order) blog

Friday, December 11, 2015
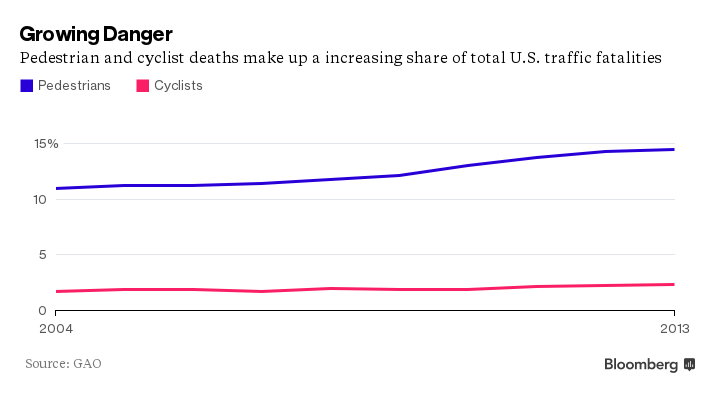
One-Third of Pedestrians And One-Fifth Of Cyclists Who Died In Traffic Accidents Were Alcohol Impaired
From BloombergBusiness, "More American Pedestrians and Cyclists Are Getting Killed on the Roads: What's really happening is that overall traffic deaths have fallen sharply, while pedestrian and cyclist deaths have remained flat." by Patrick Clark:
Source: BloombergBusiness
Pedestrians accounted for 14 percent of traffic deaths in 2013, according to a report released Thursday by the Government Accountability Office, up from 11 percent in 2004. For cyclists, those figures increased from 1.7 percent in 2004 to 2.2 percent in 2013. What's really happening in the chart above is that overall traffic deaths have fallen sharply, from about 43,000 in 2004 to about 33,000 in 2013, while pedestrian and cyclist deaths have remained flat.*** [H]ere's some information that the GAO report turned up from the National Highway Traffic Safety Administration's Fatality Analysis Reporting System:
- 69 percent of pedestrian victims and 87 percent of cyclists were men.
- Most of the deaths occurred between 3 p.m. and midnight.
- One in three pedestrians and one in five cyclists had a blood-alcohol content of more than .08, which is considered alcohol-impaired in all 50 states. [Emphasis added.]
Monday, December 7, 2015
CBO Estimates ACA To Reduce Labor Force Participation By 2 Million Full-Time Equivalent Workers By 2025
From Congressional Budget Office, "How CBO Estimates the Effects of the Affordable Care Act on the Labor Market: Working Paper 2015-09" by Edward Harris, Tax Analysis Division, Congressional Budget Office and Shannon Mok, Tax Analysis Division, Congressional Budget Office:
Summary*** CBO’s current estimate of the ACA’s effect on the labor supply in 2025 is the sum of several components
(see Table 1) [Table omitted.]:The projected reduction in the labor supply would occur in several ways. Some people would choose to work fewer hours; others would leave the labor force entirely or remain unemployed for longer than they otherwise would. CBO did not split its estimate of the overall reduction into the reduction in the number of hours worked and the reduction in labor force participation, because in formulating its estimate, the agency generally relied on labor supply elasticities (which measure the change in the labor supply resulting from a change in tax rates) that combined those two decisions. CBO did, however, translate the reduction in the labor supply into an effect on full-time-equivalent employment. The labor force is projected to be about 2 million full-time-equivalent workers smaller in 2025 than it would have been otherwise. [Emphasis added.]
- Health insurance coverage expansions—comprising exchange subsidies, rules governing health insurance, and an expansion of the Medicaid program—are together expected to reduce the labor supply by 0.65 percentage points.
- The HI surtax is expected to reduce the labor supply by 0.12 percentage points.
- Other major provisions—a penalty on larger employers that do not offer insurance coverage, an excise tax on certain high-premium insurance plans, and a penalty on certain individuals who do not obtain coverage—are together expected to reduce the labor supply by 0.10 percentage point.
Possibility That Global Greenhouse Emissions Have Peaked And May Be Starting A Long-Term Decline
From The New York Times, "Period of Soaring Emissions May Be Ending, New Data Suggest" by Justin Gillis and Chris Buckley:
Industrial emissions of greenhouse gases rose only slightly in 2014 and appear to be on track to decline in 2015, according to new data that raise the possibility that a period of rapid global emissions growth may be coming to an end.
The decline of 0.6 percent projected for this year, should it come to pass, would be highly unusual at a time when the global economy is growing. The projection contrasts sharply with emissions growth that averaged 2.4 percent a year over the last decade, and sometimes topped 3 percent.The new figures were released at the climate conference here by the Global Carbon Project, a collaboration that studies emissions, and published simultaneously in the journal Nature Climate Change.
*** The new figures suggest that there is a chance that global emissions have already peaked and may be starting a long-term decline, experts said Monday, which would be an important inflection point for the international effort to limit the risks of global warming. [Emphasis added.]
Change In Average Hourly Earnings By Industry Since 2013
From The Wall Street Journal, Real Time Economics, "Wages Are Growing 2.3%, But Your Paycheck Probably Isn’t" by Eric Morath:
Consistent job growth is supporting steadier paycheck gains, but raises are uneven and concentrated in high- and low-wage jobs.
Source: The Wall Street Journal
Wage gains at the high end and low end of the spectrum are growing well faster than the 4.5% advance for all private-sector workers since November 2013. Meanwhile, typically middle-class jobs such as those in manufacturing, transportation and education and health services are growing at a substandard pace.

Friday, December 4, 2015
Obama's Ideological Belief In Social Movement Theory Prevents The US from Effectively Responding To Extremist Violence And Threats
From The Council on Global Security, WHITE PAPER, "The Flawed Science Behind America’s Counter-Terrorism Strategy" by Katharine C Gorka:
Executive SummarySocial Movement Theory sees perpetrators of violence and terrorism as victims who are justifiably responding to unjust and unfair political, institutional, cultural, sociological, and economic causes. The movement focuses are responding to the hypothetical causes to prevent future terrorism instead of denouncing the legitimacy of and focusing on the actual violence perpetrated and using punishment and deterrence to prevent future extremist violent acts.*** President Barack Obama and a number of his top counter-terrorism advisors see Islamic extremism through the lens of Social Movement Theory, according to which extremists are viewed as “activists” with legitimate grievances, whether against colonialism, modernism, poverty and unemployment, or simply "the West."
As a result, Obama’s CT strategy has focused primarily on targeting individual perpetrators and addressing "upstream causes," rather than on countering an ideology that is at war with the United States.
Moreover, if you see economic or political grievances at the root of all terrorism, you must then set yourself a course of solving all of those grievances.*** Social Movement Theory and the Presidency of Barack Obama
Social movement theory seeks to understand the origins and consequences of collective mobilization. It had its origins in the socialist labor movements of the 1800s, and interest in social movement theory was revived and reborn with the social protest movements of the 1960s. Given its grounding in these periods of Marxist or socialist-inspired uprisings, it is not surprising that implicit in social movement theory is a perspective that sees the world divided between the owners of production and the workers, exploiters and exploited, slaves and masters.*** This perspective is reflected in the Obama administration’s view of Islam:*** Social Movement Theory and Islamic Activism
While it was President Obama who elevated to national policy the notion of legitimate Muslim grievances as the explanation for terrorism, the idea had been incubating for nearly twenty years. Recasting Islamist extremism as "Islamic activism" began around 1984 with academics who were concerned with what they saw as the relationship between "cultural imperialism" and "Islamic movements". [Footnotes omitted.]
Land Use Regulations Have Increased Since 1970s: Raising Home Prices More Than Costs: Decreasing Affordability And New Apartment Construction: Increasing Sprawl: Exacerbating Housing Bubbles: Reducing Productivity
From BloombergView, "Your Landlord Is a Drag on Growth" by Noah Smith:
... U.S. Jason Furman, the chairman of the Council of Economic Advisers, gave a recent speech to the Urban Institute in which he .... noted that Americans are moving much less than they used to, and are also switching jobs less frequently.*** Since the late 1970s, land-use regulation has skyrocketed in the U.S. That has caused housing prices to go up at a much faster rate than construction costs -- something sure to please existing homeowners, but which locks potential homeowners out of the market. The more zoned a city is, the less affordable it tends to be. Bloomberg View’s Justin Fox recently reported on how many fewer apartments are built these days. Undoubtedly, much of that is due to stricter land-use regulation.*** Furman shows that states with more constrained housing supply have seen much slower income convergence between different cities. That strongly implies that land-use restrictions are effectively keeping people penned up in bad locations.
Of course, this is in addition to the other problems that zoning causes, such as the environmental costs of sprawl, the potential exacerbation of housing bubbles, and the productivity drag from reduced density.
Thursday, December 3, 2015
Electric Car Batteries Lose More Than Half Their Range In Cold Climates
From BloombergBusiness, "Electric Cars Can’t Take the Cold: Batteries generate power less efficiently as temperatures drop." by Jeff Plungis:
The batteries used by the greener cars generate electricity from chemical reactions that work less efficiently as temperatures drop. In tests conducted by the American Automobile Association, an electric car that ran for 105 miles at 75F went only 43 miles at 20F—a 60 percent reduction in range.
That’s causing anxiety in places such as Maine, a mostly rural state where people drive long distances for work, shopping, and recreation. "People said don’t worry about it," says Tom Brown, president of the Maine Automobile Dealers Association of the battery range problem. But, he says, "California is not Maine. They’ve got more people in five city blocks than we do in the whole state."*** The bottom line: Nine states have adopted California’s targets for electric car sales, even though the batteries don’t work well in the cold.
Wednesday, December 2, 2015
Median Rent Increases Outpacing Median Household Income Growth
From The Wall Street Journal, "Some Families Earn Six Figures and Still Need Help With the Rent: Cities beyond New York and San Francisco move to set aside apartments for middle-income households; Cambridge, Mass., with $2,750 median rents, holds housing lottery" by Laura Kusisto and Jon Kamp:
Source: The Wall Street Journal

Friday, November 27, 2015
Huge Increase In Opioid Addiction Among Seniors
From the National Institutes of Health, MedlinePlus, "Those in Their 50s Now Largest Group Battling Addiction to Narcotics: Study: Big jump also seen in those aged 60 and older needing treatment for painkiller, heroin abuse" by Robert Preidt:
Older adults are now the largest age group seeking help in narcotic painkiller and heroin treatment programs, a study based in New York City found.*** People aged 50 to 59 accounted for about 8 percent of narcotic painkiller and heroin treatment patients in 1996, but they represented nearly 36 percent in 2012. The proportion of patients aged 60 to 69 also rose dramatically, from 1.5 percent to 12 percent, the study revealed.
"These increases are especially striking, considering there was about a 7.6 percent decrease in the total patient population over that period of time, and suggests that we are facing a never before seen epidemic of older adults with substance use disorders and increasing numbers of older adults in substance abuse treatment," Han said.
The proportion of such patients aged 40 and younger fell from about 56 percent in 1996 to about 20 percent in 2012, the study showed.
Friday, November 20, 2015
Uncertainty Forecast Ranges Of CBO's Long-Term Budget Projections
From Congressional Budget Office, "The Uncertainty of Long-Term Budget Projections" Presentation by Ben Page:
CBO’s long-term budget projections generally reflect current law and estimates of future economic conditions and demographic trends. Those projections depend on estimates of the future paths of mortality rates, productivity, interest rates, and health care costs, among many other variables. To illustrate some of the uncertainty about long-term budgetary outcomes, CBO constructed alternative projections showing what would happen to the budget if those factors differed from the values used in the extended baseline.
Thursday, November 19, 2015
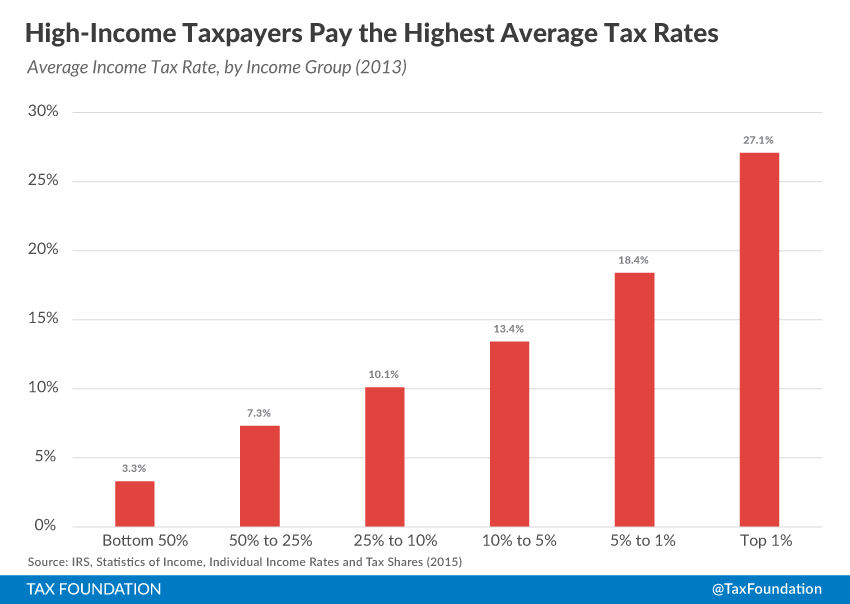
High-Income Americans Pay The Majority of Federal Taxes And Pay The Highest Average Tax Rates
From Tax Foundation, "Summary of the Latest Federal Income Tax Data, 2015 Update" by Scott Greenberg:
High-Income Americans Paid the Majority of Federal Taxes
In 2013, the bottom 50 percent of taxpayers (those with AGIs below $36,841) earned 11.49 percent of total AGI. This group of taxpayers paid approximately $34 billion in taxes, or 2.78 percent of all income taxes in 2013.
In contrast, the top 1 percent of all taxpayers (taxpayers with AGIs of $428,713 and above), earned 19.04 percent of all AGI in 2013, but paid 37.80 percent of all federal income taxes.
In 2013, the top 1 percent of taxpayers accounted for more income taxes paid than the bottom 90 percent combined. The top 1 percent of taxpayers paid $465 billion, or 37.80 percent of all income taxes, while the bottom 90 percent paid $372 billion, or 30.20 percent of all income taxes.
Chart 1.
 |
| Source: Tax Foundation |
*** Chart 2.
 |
| Source: Tax Foundation |
Wednesday, November 18, 2015
US Annual Solar Photovoltaic (Solar Panel) Installations In Megawatts
From The Wall Street Journal, Journal Reports: Energy, "Will Solar Energy Plummet if the Investment Tax Credit Fades Away? Many solar supporters say the loss or reduction of the credit will be a ‘cliff’ for the industry. But others say the credit’s impact is overstated and solar will continue to grow:"
Source: The Wall Street Journal

Tuesday, November 17, 2015
States With The Worst And Best Business Tax Climates
From Tax Foundation, "2016 State Business Tax Climate Index" by Jared Walczak, Scott Drenkard, Joseph Henchman:
The Index is designed to show how well states structure their tax systems, and provides a roadmap for improvement.
The 10 best states in this year’s Index are:1. Wyoming
2. South Dakota
3. Alaska
4. Florida
5. Nevada
6. Montana
7. New Hampshire
8. Indiana
9. Utah
10. Texas*** The 10 lowest ranked, or worst, states in this year’s Index are:
41. Maryland
42. Ohio
43. Wisconsin
44. Connecticut
45. Rhode Island
46. Vermont
47. Minnesota
48. California
49. New York
50. New Jersey
Lower Percentage Of College Students Are Graduating
From The Wall Street Journal, "College Graduation Rate Shrinks, Study Finds: Research shows just 52.9% of students who began four-year programs in fall 2009 had graduated" by Melissa Korn:
Just 52.9% of students who began four-year programs in fall 2009 had graduated from such institutions within six years, according to a report released Tuesday by the National Student Clearinghouse Research Center, compared with 55% for the class that started in 2008 and 56.1% the year before that.*** But students of all ages, and at all types of institutions, completed school at a lower rate than those who started down the college path the prior year.*** Though a smaller percentage of students made it to the finish line this year, the total number of graduates increased by about 71,000 for the latest class, since more students—2.9 million—entered college in 2009 than in the prior year.
Subscribe to:
Posts (Atom)