The U.S. is experiencing a baby lull that looks set to last for years, a shift demographers say will likely ripple through the U.S. economy and have an impact on everything from maternity wards to federal social programs.
*** ...the U.S. may not soon return to its pre-recession average of about two babies for every adult woman. Some demographers have pared their forecasts for future births because an expected post-recession baby boom has been smaller than anticipated.
The leveling-off in births is weighing on sales at children’s stores, prompting hospitals to rework their birth wards and putting pressure on builders of single-family homes, executives and economists say.***
Source: The Wall Street Journal
Wednesday, May 11, 2016
Current US Birth Rate Below Pre-Recession Levels: Expected To Stay At Lower Level
From The Wall Street Journal, "Baby Lull Promises Growing Pains for Economy: Slow rebound in post-recession birth rates challenges businesses, poses long-term test for government programs" by Janet Adamy:


Substantial Decline In Minimum Wage And Involuntary Part Time Jobs Since 2010: Most Of The Increase In Minimum Wage And Involuntary Part Time Jobs Occurred During The Recession in 2008 And 2009
From The Wall Street Journal, Real Time Economics, "Just How Good (or Bad) Are All the Jobs Added to the Economy Since the Recession? We take a closer look at employment and wage data to see the makeup of newly created jobs" by Lam Thuy Vo and Josh Zumbrun:
Overall, the data also show that more people work minimum wage or involuntarily part time than prior to the recession. But most of this increase occurred during the recession in 2008 and 2009.
The number of minimum wage and part time workers has declined over the past five years. There are currently about 2.6 million workers earning the minimum wage. That’s up from 1.7 million in 2007, but down substantially from 4.4 million in 2010. There are currently about six million people who work part time but want full-time hours. That’s up from about four million in 2007, but down substantially from nine million in 2009 and 2010.
Monday, May 9, 2016
Share Of Young Men Jobless Or Incarcerated By Education Level: CBO
From Congressional Budget Office, May 9, 2016, "Trends in the Joblessness and Incarceration of Young Men:"


In 2014, 16 percent of men in the United States between the ages of 18 and 34 were jobless or incarcerated, up from 11 percent in 1980. Those numbers and related longer-term trends have significant economic and budgetary implications.View CBO Document
In 2014, there were 38 million men in the United States between the ages of 18 and 34; about 5 million of those young men were jobless, and 1 million were incarcerated. Those numbers and some related longer-term trends have significant economic and budgetary implications. Young men who are jobless or incarcerated can be expected to have lower lifetime earnings and less stable family lives, on average, than their counterparts who are employed or in school. In the short term, their lower earnings will reduce tax revenues and increase spending on income support programs, and the incarceration of those in federal prison imposes costs on the federal government. Farther in the future, they will probably earn less than they would have if they had gained more work experience or education when young, resulting in a smaller economy and lower tax revenues.
The share of young men who are jobless or incarcerated has been rising. In 1980, 11 percent of young men were jobless or incarcerated; in 2014, 16 percent were (see figure below). Specifically, 10 percent of young men were jobless in 1980, and 1 percent were incarcerated; those shares rose to 13 percent and 3 percent in 2014.
Layoffs Have Negative Effects On Rehired Workers: Lower Future Earnings And Lower Home Ownership
From The Wall Street Journal, "The Recession’s Economic Trauma Has Left Enduring Scars: Effects of losing a job linger, from lower wages and home ownership rates to psychological problems" by Ben Leubsdorf:
Even for the millions of Americans back at work, the effects of losing a job will linger, the research suggests. They will earn less for years to come. They will be less likely to own a home. Many will struggle with psychological problems. Their children will perform worse in school and may earn less in their own jobs.[Emphasis added.]
*** Labor Department data show 40 million layoffs and other involuntary discharges during the recession that began in December 2007 and ended in June 2009. The official unemployment rate peaked at 10%. Princeton University economist Henry Farber calculated that the rate of job loss from 2007 through 2009 was 16%.
Wage scarring
As in previous recessions, millions of Americans faced a phenomenon economists sometimes call wage scarring. People who lose a job, even during economic expansions, usually earn less money when they re-enter the workplace. They are out of work for a time and often take a pay cut as the price of returning to work at a new employer or even in a new career.
***
Source: The Wall Street Journal

Saturday, May 7, 2016
Quarter Of Home Energy Use Is From Devices Turned Off
From The New York Times, "Just How Much Power Do Your Electronics Use When They Are ‘Off’?" by Tatiana Schlossberg:
Once upon a time, there was a difference between on and off. Now, it’s more complicated: Roughly 50 devices and appliances in the typical American household are always drawing power, even when they appear to be off, estimates Alan Meier, a senior scientist at the Department of Energy’s Berkeley Lab.
It adds up. About a quarter of all residential energy consumption is used on devices in idle power mode, according to a study of Northern California by the Natural Resources Defense Council.
Friday, May 6, 2016
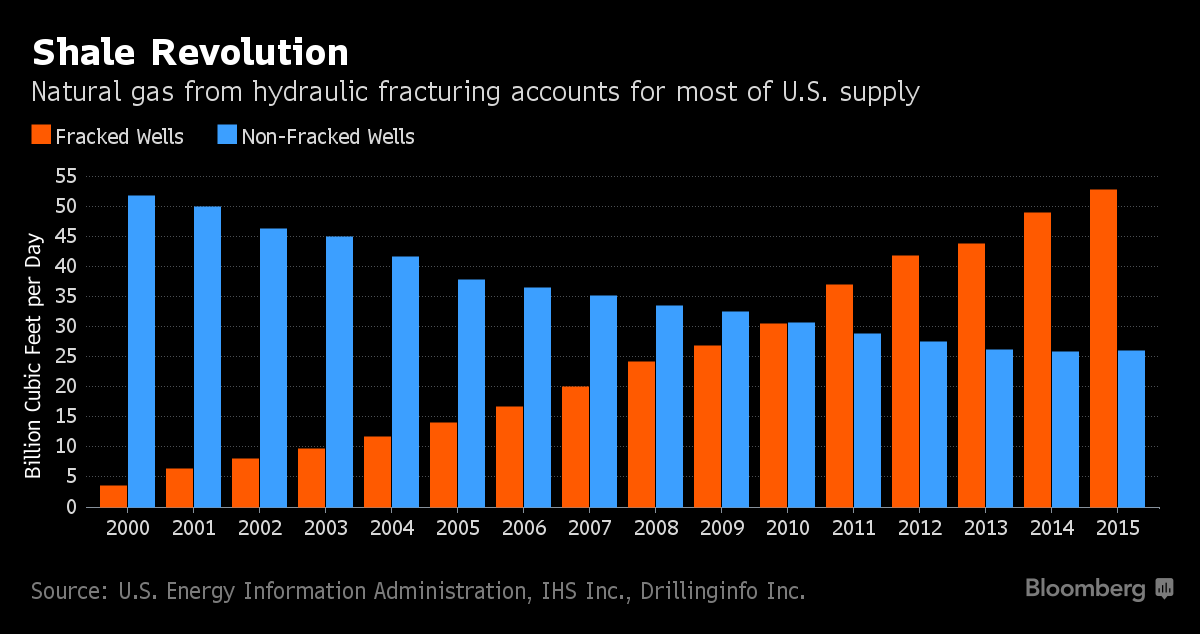
67 Percent Of US Natural Gas Supply From Fracked Wells
From Bloomberg, "Two-Thirds of U.S. Gas Supply Now Comes From Fracking" by Christine Buurma:
Source: Bloomberg *** Fracking now accounts for 67 percent of marketed gas output, up from less than 7 percent in 2000, according to the U.S. Energy Information Administration.
Tuesday, May 3, 2016
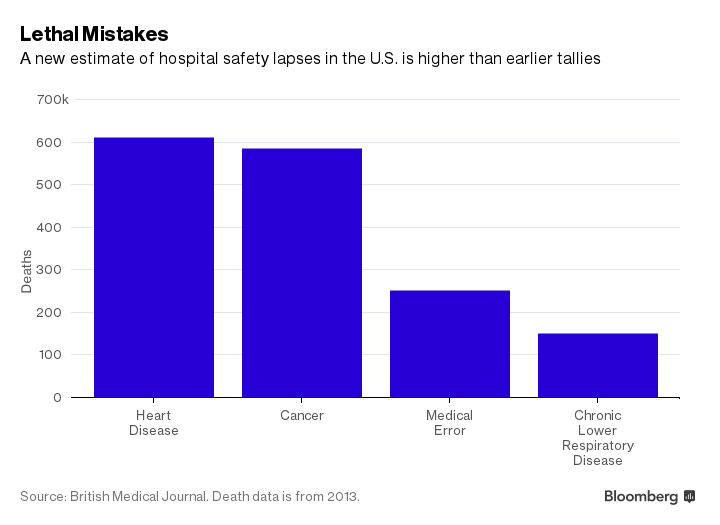
Medical Errors Are Third Leading Cause Of Death, Behind Heart Disease And Cancer Deaths
From Bloomberg, "Medical Errors Are Leading Killer After Heart Disease and Cancer, Study Finds: Mistakes cost a quarter of a million lives a year in the U.S., Johns Hopkins reports, up from famous estimate of 100,000 in 1999." by John Tozzi:
After heart disease and cancer, medical errors kill more Americans than anything else, claiming a quarter of a million lives a year, according to a study by researchers at Johns Hopkins University.
If bungles and safety lapses in the hospital were accounted for as deaths from disease and injury are, they would be the third most common cause of death in the U.S., leading to more fatalities than respiratory disease, the report in the British Medical Journal argues.
Source: Bloomberg
Saturday, April 30, 2016
Less Than 1 Percent Of NYS Earners ($1 Million Or More) Pay 40 Percent Of New York's Total Income Tax
From lohud, The Journal News, "Number of NY millionaires fluctuates" by Joseph Spector:
The number of wealthy New York households is vital to the state's fiscal health.
The $1 million or more earners pay about 40 percent of the state's total income taxes, despite making up less than 1 percent of the total tax filers, state budget documents show.*** "They are a bigger part than ever before in history of our total tax revenues, but the incomes are more volatile than any time in living memory," said E.J. McMahon, president of the Empire Center, a fiscally conservative think tank in Albany.
McMahon said that IRS data shows that New York's increase in millionaires was less than the national pace: New York's increase was about 8 percent between 2011 and 2013, but it was up nationally by about 11 percent.
Friday, April 29, 2016
Chart Of Federal, State And Local Government Spending On Highways From 1956 To 2014
From Columbia Ideas at Work, "As Highways Crumble, the Private Sector Steps Up — for a Price" by Matt Schiavenza, based on reseacrh by Prof. Robert Phillips and Prof. Garrett van Ryzin:
Federal, state and local government spending on highways in billions of 2014 dollars.
Data: Congressional Budget Office
Source: Columbia Ideas at Work

Public's Perception Of The Leadership Traits Of The Four Major Presidential Candidates Based On Gallup Survey
From Gallup, "Presidential Candidates as Leaders: The Public's View" by Frank Newport and Jim Harter:
So we [Gallup] set out to assess the degree to which Americans believe that each of the four major presidential candidates possess each of a list of 12 leadership traits that Gallup has found to be important in helping distinguish leadership styles and in distinguishing successful from unsuccessful leaders.*** Using a five-point scale, where "5" means it describes the candidate perfectly and "1" means it does not describe the candidate at all, please rate your overall impression of:
% Rating candidate a "4" or a "5"
Hillary Clinton% Ted Cruz% Bernie Sanders% Donald Trump% Intense 52 47 50 77 Competitive 70 56 49 84 Inspiring 25 21 48 29 Courageous 35 29 50 33 Prepared 51 38 48 27 Consistent 28 36 62 26 Enthusiastic 42 41 60 62 Cares about individuals 29 25 61 19 Emphasizes success 42 36 39 68 Analytical 43 33 41 29 Focused 55 48 59 44 Visionary 26 26 55 34 GALLUP, MARCH 2016
The table shows that, while the candidates vary considerably on many perceived traits, U.S. adults tend to give candidates higher ratings across the board on some dimensions and lower ratings on others. Specifically, respondents are most likely to believe the four major presidential candidates are competitive, intense, focused and enthusiastic, and are least likely to see the candidates as inspiring, caring and visionary. [Emphasis added.]
Thursday, April 28, 2016
69 Percent Of Recent High School Graduates Enrolled In College: 2 In 3 Enrollees Attend 4-Year Colleges
From US Bureau of Labor Statistics, Economic News Release, April 28, 2016, "College Enrollment and Work Activity of 2015 High School Graduates:"
Recent High School Graduates and Dropouts
Of the 3.0 million youth age 16 to 24 who graduated from high school between January and October 2015, about 2.1 million (69.2 percent) were enrolled in college in October. The college enrollment rate of recent high school graduates in October 2015 was little different from the rate in October 2014 (68.4 percent). For 2015 high school graduates, the college enrollment rate was 72.6 percent for young women and 65.8 percent for young men. The college enrollment rate of recent Asian (83.0 percent) graduates was higher than for their White (71.1 percent), Hispanic (68.9 percent), and Black (54.6 percent) counterparts.
*** Among recent high school graduates enrolled in college in October 2015, about 9 in 10 were full-time students. Recent graduates enrolled as full-time students were about half as likely to be in the labor force (32.9 percent) as were their peers enrolled part time (69.3 percent).
About 2 in 3 recent high school graduates enrolled in college attended 4-year colleges. Of these students, 29.5 percent participated in the labor force, compared with 47.3 percent of recent graduates enrolled in 2-year colleges.
Wednesday, April 27, 2016
38 Percent Of US High School Graduates Lack Basic Math Ability And 28 Percent Lack Basic Reading Ability: 37 Percent Are Prepared For College Math And Reading
From The Wall Street Journal, "Just 37% of U.S. High School Seniors Prepared for College Math and Reading, Test Shows: Results from Nation’s Report Card show slight dip from two years earlier" by Leslie Brody:
Only 37% of American 12th-graders were academically prepared for college math and reading in 2015, a slight dip from two years earlier, according to test scores released Wednesday.*** The biggest problems came at the bottom, with growth in the share of students deemed “below basic” in their abilities. In math, 38% of students were in that group in 2015, compared with 35% two years earlier. In reading, 28% of students were “below basic,” compared with 25%.*** In reading, 49% of Asian students performed at or above proficiency last year. So did 46% of white students, 25% of Hispanic students and 17% of black students.*** In math, 47% of Asian students performed at or above proficiency. So did 32% of white students, 12% of Hispanic students and 7% of black students.
Monday, April 18, 2016
Indicators Show US Business Competition Is Decreasing
From The Wall Street Journal, "Competition: Every market is unique and some rules can do more harm than good" by chief economics commentator Greg Ip:
In a report released April 15, President Barack Obama’s Council of Economic Advisers cite evidence of anticompetitive market power throughout the U.S. economy. In most industries, the 50 largest companies control more market share in 2012 than they did in 1997. Corporate return on capital significantly exceeds the cost of capital by a large margin. Returns have risen far more for the most profitable companies than the least profitable. In a perfectly competitive market, new capital should flood into those profitable industries, driving down the incumbents’ returns.Read the Council Of Economic Advisers Issue Brief, April 2016, "Benefits Of Competition And Indicators Of Market Power."
Several indicators suggest that competition may be decreasing in many economic sectors, including the decades-long decline in new business formation and increases in industry-specific measures of concentration.*** The causes underlying a possible decrease in competition and corresponding increase in market power are not clear, but candidate explanations include efficiencies associated with scale, increases in merger and acquisition activity, firms’ crowding out existing or potential competitors either deliberately or through innovation, and regulatory barriers to entry such as occupational licensing that have reduced the entry of new firms into a variety of markets.
Cities That Do Not Expand Their Land Area See Much Higher Home Price Increases Than Cities That Have Room To Grow
From The Wall Street Journal, Real Time Economics, "Why the Great Divide Is Growing Between Affordable and Expensive U.S. Cities" by Laura Kusisto:
Source: The Wall Street Journal *** "If you don’t let the city grow, you’re going to get prices going upward…and see the middle class being pushed out," Mr. [Issi] Romem said.*** Mr. Romem said ideally cities would relax regulations and build upward rather than outward. But, he said, promoting development on empty fields is more politically feasible than building apartment towers in single-family neighborhoods, and thus likely to ease affordability pressures more quickly.
Many of the more expensive cities are prevented from growing outward by natural barriers, such as oceans or mountains. Those cities are unlikely to grow significantly upward or outward in the next couple of decades, he said, and thus the price divide is likely to continue to widen.

Friday, April 15, 2016
Federal Government Charges Higher Graduate Student Loan Interest Rates To Subsidize And Lower College Student Loan Interest Rates
From The Wall Street Journal, Real Time Economics, "Clinton and Sanders Say Student Loan Rates Are Too High; Here’s What’s Going On" by Josh Mitchell:
Is the Government Profiting From Student Loans?
It depends on the math.
The government uses an accounting method that differs from that of private lenders, and under that accounting method, it books a profit. But using the private sector’s method, student loans lose money.
Even under the government’s accounting method, it loses money on undergraduate student loans. It does, however, book a profit by lending to graduate students and parents, who pay higher interest rates than undergraduates. Essentially, the government is taxing graduate students to subsidize undergraduate students. [Emphasis added.]
Monday, April 11, 2016
My BloombergView Comment To "The Real Reason Women Still Get Paid Less" by Cass Sunstein
My comment to BloombergView, "The Real Reason Women Still Get Paid Less" by Cass R. Sunstein:
Wages, which are the basis of the studies of men and women work pay, are not the same as total compensation. Total compensation includes the value of hard dollar benefit packages, such as employer paid healthcare, dental and eye care, health club membership, paid sick, personal and vacation days, subsidized daycare, flextime, employer paid pension (401k, etc.) payments, etc. The publicized men women wage ratio does not include the value of different benefit packages among different companies and industries. There are indications in the studies that men gravitate towards industries and companies with higher pay with lesser benefits, while women forego more wages for companies and industries with better benefit packages. There are also indications that there are soft dollar benefits that women prefer more than men, such as less out of town travel, less unplanned overtime, less work on weekends, fixed scheduling, less night work, jobs with lower injury and death rates, etc.
Studies need to look at total compensation cost to employers to see if the costs of employing women are less than the costs of employing men before any claims about discrimination are made. Unfortunately, the studies that claim a wage gap do not look at total employer costs. The US DOL did a study a bunch of years ago and found the wage gap disappears when non-wage costs are considered.
Soft dollar lifestyle job considerations must also be valued and included, such as frequent and sometimes unexpected travel away from home, unplanned overtime, the need to take work home or work on weekends, and job injury and death rates.
Unless a study values all job characteristics and benefits, any claim of a male-female wage gap or of job gender pay discrimination is meaningless; Studies finding a wage gap are most likely a product of incomplete compensation data than they are of employer gender pay discrimination. If the wage gap were not the case of incomplete data, US DOL would be filing and winning 100s of wage discrimination cases, which it is not doing. If women were truly paid less, then all companies would be actively hiring many more women including women executives to improve their profits and companies with more women in their employ would be selling products at lower prices and putting their competitors out of business.
The reality of the workplace is that men and women choose different job characteristics with different wages, but on whole the total employer costs, hard and soft benefits, and wages, are equal for men and women.
Friday, April 8, 2016
Adults Born In The Early 1980s Held An Average Of 7.2 Jobs From Age 18 To 28, And Other Young Adult Statistics: Longitudinal Study, US Bureau Of Labor Statistics
From Bureau Of Labor Statistics, Economic News Release, "America's Young Adults at 29: Labor Market Activity, Education and Partner Status: Results from a Longitudinal Survey:"
Young adults born in the early 1980s held an average of 7.2 jobs from age 18 through age 28, the U.S. Bureau of Labor Statistics reported today. Individuals held more jobs at younger ages, and the number of jobs held declined as individuals aged. Young adults held an average of 3.9 jobs from ages 18 to 21 compared with 2.5 jobs from ages 25 to 28. From ages 18 to 28, women with more education held more jobs than women with less education. Regardless of education, men held a similar number of jobs.*** Highlights from the longitudinal survey data [Tables available in embedded press release below.]:
- By 29 years of age, 34 percent of women had received a bachelor’s degree, compared with 26 percent of men. Seventy-two percent of women had attended college compared with 63 percent of men. (See table 1.)
- Young adults held an average of 7.2 jobs from ages 18 through 28, with over half of these jobs being held between the ages of 18 and 21. (See table 2.)
- Women with less than a high school diploma were employed an average of 41 percent of weeks from ages 18 to 28, while men with less than a high school diploma were employed 63 percent of weeks. Among young adults with a bachelor’s degree and higher, women were employed an average of 79 percent of weeks, while men were employed 75 percent of weeks. (See table 3.)
- Young adults were employed for an average of 74 percent of weeks from ages 18 to 28. This varied across age brackets: individuals were employed 67 percent of weeks from ages 18 to 21, 77 percent of weeks from ages 22 to 24, and 78 percent of weeks from ages 25 to 28. (See table 4.)
- Almost 50 percent of jobs held by high school dropouts from ages 18 to 28 were held for less than 6 months. For those with a bachelor’s degree and higher, 34 percent of jobs were held for less than 6 months. (See table 5.)
- At the time of their 29th birthday, 40 percent of young adults were married, 20 percent were cohabiting, and 40 percent were single. The percent of young adults living with a partner did not vary by education, though those with higher levels of education were more likely to be married and less likely to be cohabiting than those with lower levels of education. (See table 6.)
- Men who were single at age 29 were employed 70 percent of the weeks from ages 18 to 28, compared with 83 percent for those who were married and 76 percent for those who were cohabiting. The percentage of weeks employed did not vary substantially by partner status for women. (See table 7.)
America's Young Adults at 29, Labor Market Activity, Education and Partner Status, Results From a Longitudi... by Milton Recht
Thursday, April 7, 2016
Large Cost Of Living Differences Within States Complicates Value Of Minimum Wage
From Pew Research Center, "Cost-of-living disparities within states complicate minimum-wage debate" by Drew DeSilver:
One factor complicating the minimum-wage discussion is that the cost of living varies widely – not just from state to state but within individual states, something that’s especially true in large, diverse states such as California and New York. The real value of $15 (that is, its purchasing power) very much depends on where you live: A wage that might be barely adequate in a big city could be well above the norm in a rural small town.
*** The price level in metropolitan Chicago, while only 6.6% above the national average, is 34.6% above the price level in Danville, a small city about 140 miles to the south that is the second-cheapest place to live in the nation.
Not far behind Illinois are California and New York, where the most-expensive metro areas are 33.2% and 31.9% higher, respectively, than the least-expensive places. The states with the smallest gaps, such as Idaho, Wyoming and Vermont, tend to be largely rural places with few (or no) big cities.

US Prison Population Declining Since Its 2007 Peak
From Bloomberg, "The Prison Population Is Actually Falling in the U.S.: The incarceration rate in the U.S. peaked in 2007 and has been tapering off ever since." by Deirdre Fretz:
The number of sentenced prisoners in the U.S. has been falling (ever so slightly) in recent years.
Source: Bloomberg
Nationwide, incarceration rates of sentenced prisoners peaked in 2007 and have been tapering off in the years since, Bureau of Justice Statistics data show. Between 2009 and 2014, state prison populations fell 8 percent and federal prison rates declined 2 percent. Some states in particular have seen significant declines. For example, the population of state and federal prisons within California fell from 342 per 100,000 state residents in 2007 to 257 in 2014. The incarceration rate in New Jersey fell from 311 to 241 over the same period.

Wednesday, April 6, 2016
Americans Will Pay More On Taxes In 2016 Than They Will Spend On Food, Clothing, And Housing
From Tax Foundation, "Tax Freedom Day 2016 is April 24" by Scott Greenberg:
In 2016, Americans will pay $3.34 trillion in federal taxes and $1.64 trillion in state and local taxes, for a total tax bill of $4.99 trillion, or 31 percent of national income.
***
 |
| Source: Tax Foundation |
Subscribe to:
Posts (Atom)