A 1997 US law mandated the registry’s creation, requiring researchers from 2000 to record their trial methods and outcome measures before collecting data. The study found that in a sample of 55 large trials testing heart-disease treatments, 57% of those published before 2000 reported positive effects from the treatments. But that figure plunged to just 8% in studies that were conducted after 2000. Study author Veronica Irvin, a health scientist at Oregon State University in Corvallis, says this suggests that registering clinical studies is leading to more rigorous research. Writing on his NeuroLogica Blog, neurologist Steven Novella of Yale University in New Haven, Connecticut, called the study “encouraging” but also “a bit frightening” because it casts doubt on previous positive results.*** Irvin says that by having to state their methods and measurements before starting their trial, researchers cannot then cherry-pick data to find an effect once the study is over. “It’s more difficult for investigators to selectively report some outcomes and exclude others,” she says.
Sunday, August 16, 2015
Clinical Trial Registration Law Prevents Cherry Picking Medical Results: Lowered Reported Positive Treatment Effects From 57 Percent To 8 Percent: Raises Question Of Accuracy of Medical Treatment Studies Prior To The Year 2000
From Nature, Research Highlights, "Registered clinical trials make positive findings vanish: A study showing a fall in positive trial results after the roll-out of clinicaltrials.gov attracted much attention on social media." by Chris Woolston:

Thursday, August 13, 2015
More Than Twice As Many Viewers Watched The First Republican Presidential Debate As The 2008 Obama Clinton Debate
From The Wall Street Journal, "Donald Trump, the Kingmaker: Trump has enabled the next U.S. president. But it won’t be him." by Daniel Henninger:
But Mr. Trump just did something unique in presidential politics: He delivered 24 million prospective voters to the Republican Party in its Aug. 6 primary debate on Fox News. It is a mind-boggling number.
In 2008, wunderkind Barack Obama debated Hillary Clinton—favored then as now—and 10.7 million watched, less than half Thursday’s audience. The earlier, happy-hour GOP debate Thursday had six million viewers.
Tuesday, August 11, 2015
White House Occupational Licensing Report: Since 1950s, A Five-Fold Increase In Jobs That Require A License
About one-quarter of US workers need a license to do their jobs, a five-fold increase since the 1950s.
From the Executive Summary of the White House report:
White House Occupational Licensing Report
From the Executive Summary of the White House report:
Executive Summary
Over the past several decades, the share of U.S. workers holding an occupational license has grown sharply. When designed and implemented carefully, licensing can offer important health and safety protections to consumers, as well as benefits to workers. However, the current licensing regime in the United States also creates substantial costs, and often the requirements for obtaining a license are not in sync with the skills needed for the job. There is evidence that licensing requirements raise the price of goods and services, restrict employment opportunities, and make it more difficult for workers to take their skills across State lines. Too often, policymakers do not carefully weigh these costs and benefits when making decisions about whether or how to regulate a profession through licensing. In some cases, alternative forms of occupational regulation, such as State certification, may offer a better balance between consumer protections and flexibility for workers.
Monday, August 10, 2015
The Non-Profit Sector Share Of The US Economy Is As Large As The Information Technology Sector
From Tax Foundation, "Revenue Figures for Charitable Organizations Are at an All-Time High" by Scott Greenberg:
Source: Tax Foundation
Contrary to what you might expect, charitable organizations do not make the bulk of their revenues through donations. In 2012, only 21.3% of revenue for 501(c)3 organizations came from contributions, gifts, and grants. Instead, charitable organizations in the United States are largely funded by "program service revenue" – such as the tuition received by non-profit universities, or the medical bills collected by non-profit hospitals.
The non-profit sector represents a substantial share of the United States economy, totaling $887.3 billion and accounting for 5.4% of GDP (about the same size as the information technology industry.) It is also one of the most rapidly growing parts of the economy, with overall employment increasing by 17% between 2000 and 2010, significantly faster than private business job growth. Now, the recent IRS figures confirm that charitable organizations are receiving higher revenues than ever.

Friday, August 7, 2015
Concerns About A Substantial Increase In Poverty Rates Among Minorities From EPA's New Carbon Emission Reduction Rules
From The Washington Times, "Obama’s Clean Power Plan faces opposition from black, Hispanic leaders" by Ben Wolfgang:
The White House’s carbon emissions regulations have opened a major rift between President Obama and some black and Hispanic leaders who fear the climate change policies will drive up poverty in low-income areas, kill jobs and raise electricity rates for families that can least afford it.*** "I’m very concerned that poor people will always pay the price for people who happen to have a vision. … That goes for the EPA, for anyone who isn’t concerned about poor people. The electricity bill is going to skyrocket for poor people," said Charles Steele Jr., CEO of the Southern Christian Leadership Conference and, aside from the carbon regulations, a staunch supporter of Mr. Obama.*** In June, for example, National Black Chamber of Commerce President and CEO Harry Alford testified before a Senate panel and said the Clean Power Plan will devastate minority communities.
“The Clean Power Plan would increase black poverty by 23 percent, Hispanic poverty by 26 percent, result in cumulative job losses of 7 million for blacks, nearly 12 million for Hispanics in 2035, and decrease black and Hispanic median household income by $455 to $550, respectively, in 2035,” he told the Senate Environment and Public Works Committee, citing a study commissioned by the Black Chamber.
Wednesday, August 5, 2015
Ongoing Teacher Training Does Not Improve Teaching Performance
From The Wall Street Journal, "Study Questions Value of Teacher Development: Report from nonprofit group suggests rethinking ways to boost skills of teachers" by Leslie Brody:
TNTP, a Brooklyn-based organization that trains educators and promotes stringent evaluations, analyzed several years of data from three school districts. It found the districts spent an average of $18,000 per teacher yearly on professional development, including coaching in the classroom, formal feedback, vendor contracts for training and staff time.
Despite that investment, the report found that only three out of 10 teachers in these districts saw their practice improve substantially over two or three years, and two out of 10 teachers saw their performance decline.*** The report found that no particular approach to professional development consistently helped teachers get better. When individual teachers improved, their success didn’t appear to be linked to systemic efforts by the districts. [Emphasis added.]
Tuesday, July 28, 2015
Hillary Clinton's Policy For A Capital Gains Tax Increase And Against Stock Buybacks Is An Attack On The Wealth And Savings Of Half Of US Families
As Hillary Clinton proposes increasing the capital gains tax and riles against stock buybacks and activists investors who increase a company's market value, it is worth noting that half of Americans in the 35 to 64 age group own stock, and half of US families whose combined income is more than $40,000 a year own stock. In the 35 to 44 year old age group 54 percent own stock. An increase in the tax on stocks and an attack on stock owners is an attack on half of the US and an attack on those who are creating wealth and savings for their later years by investing during their prime working years in the stock market.
From The Wall Street Journal, Real Time Economics, "Who Owns Stocks? It’s Not Just the Rich" by Josh Zumbrun:
From The Wall Street Journal, Real Time Economics, "Who Owns Stocks? It’s Not Just the Rich" by Josh Zumbrun:
It might be tempting to assume that stock ownership is primarily a “rich-person problem,” but a look at the data shows that in fact it’s very common for middle-income families to own stocks, either directly or indirectly through retirement accounts. Stock ownership isn’t just for the rich, though it’s been trending that way.
Source: The Wall Street Journal
Among the middle 20% of families, which earn an average of $49,600, almost half own some stocks, according to the Federal Reserve’s Survey of Consumer Finances, one of the best available sources of wealth data. Among those earning in the 60th-80th percentile, or an average of about $80,000, almost 70% own stocks.
One of the key reasons that investors favor stocks is that, over the long run, the asset has historically performed very well. Thus it’s no surprise that stock wealth grows with age. Even middle-income families who sock away some savings into the market over the course of their careers can have a substantial amount of stock wealth by the time they’re near retirement. [Emphasis added.]
Source: The Wall Street Journal


Friday, July 24, 2015
Bee Population Increasing Worldwide
From AG Professional, "Bee population rising around the world" By Syngenta:
***
***
***
Contrary to what some environmental activist groups are claiming, data collected by the crop protection industry from the USDA, FAO and StatisticsCanada shows that bee populations even in intensely farmed areas of the world are increasing rather than rapidly decreasing.
UNITED STATES
According to USDA statistics, the number of honey-producing colonies has been generally steady for about two decades and has risen four of the last five years – including an increase of over 100,000 hives last year. The bee population is up nearly 13 percent since 2008, recovering after the initial findings of colony collapse disorder.
 |
| Source: AG Professional |
 |
| Source: AG Professional |
 |
| Source: AG Professional |
 |
| Source: AG Professional |
Wednesday, July 22, 2015
US Cities Losing Largest Population Share To Other Parts Of US
From BloombergBusiness, "These Are the Top 20 Cities Americans Are Ditching: Soaring costs of living meant residents left New York City and its suburbs in droves" by Erin Roman and Wei Lu:
The map below shows the 20 metropolitan areas that lost the greatest share of local people to other parts of the country between July 2013 and July 2014, according to a Bloomberg News analysis of U.S. Census Bureau data. The New York City area ranked 2nd, losing about a net 163,000 U.S. residents, closely followed by a couple surrounding suburbs in Connecticut. Honolulu ranked fourth and Los Angeles ranked 14th. The Bloomberg calculations looked at the 100 most populous U.S. metropolitan areas.
Source: Bloomberg
Interestingly, these are also the cities with some of the highest net inflows of people from outside the country. That gives many of these cities a steadily growing population, despite the net exodus of people moving within the U.S.
So what's going on here? Michael Stoll, a professor of public policy and urban planning at the University of California Los Angeles, has an idea. Soaring home prices are pushing local residents out and scaring away potential new ones from other parts of the country, he said. (Everyone knows how unaffordable the Manhattan area has become.)

My Comment To Productivity Article In The Wall Street Journal
My comment to The Wall Street Journal article, "Politicians, Pay Heed to Productivity Problem: Boosting hourly worker output could resuscitate weak wage growth" by Greg Ip:
Productivity is best understood by components at the margin and not the whole or average. There is labor productivity. After each additional worker or hour worked, how much faster will the economy's output grow. There is capital productivity. For each additional machine, or capital investment, how much faster will the economy grow. There is total factor productivity (TFP). For each new unit of labor and capital together, how much faster will the economy grow than from the sum of the extra output growth from more labor and from more capital alone.
The most volatile and least understood of the three components is total factor productivity. Technology, laws, regulations and unknown factors affect total factor productivity in both a positive and negative way.
Skills, education, experience, illness, drugs & alcohol use, etc. affect labor productivity.
Useful capital investment requires a fair return, which is not expensed on the P&L, to be worthwhile, and incorrectly shown as profit.
[Unfortunately, The Wall Street Journal's comment size limitations forced excessive conciseness.]
Voters Favor Campaign Contributions Disclosure Over Restrictions On Contributions
From Rasmussen Reports, "Does Campaign Cash Really Matter?"
When it comes to campaign contributions, most voters think disclosure is more important than restrictions. Most also still believe substance matters more than money when it comes to election outcomes.
A new Rasmussen Reports national telephone survey finds that 57% of Likely U.S. Voters now believe it is more important to disclose the source of all contributions than it is to limit how much money individuals can contribute to campaigns. Thirty-three percent (33%) think it is more important to limit campaign contributions.
Tuesday, July 21, 2015
CBO Slide Presentation On Productivity And Growth In Forecasts
From CBO slide presentation, "Productivity and Growth in CBO’s Forecasts" by Robert Shackleton, an analyst for CBO’s Macroeconomic Analysis Division, at the NABE Foundation's 12th Annual Economic Measurement Seminar:
Saturday, July 18, 2015
First Marriage Age And Divorce Risk Graph
From The Washington Post, "The best age to get married if you don’t want to get divorced" by Christopher Ingraham:
Source: The Washington Post
As you can see, the risk of divorce declines steadily from your teens into your late 20s, but somewhere in the early 30s it starts to creep back up again. As Wolfinger puts it: "Those who tie the knot after their early thirties are now more likely to divorce than those who marry in their late twenties." The chart is based on a statistical analysis of data from the National Survey of Family Growth, a nationally-representative survey administered by the CDC every few years.

Wednesday, July 15, 2015
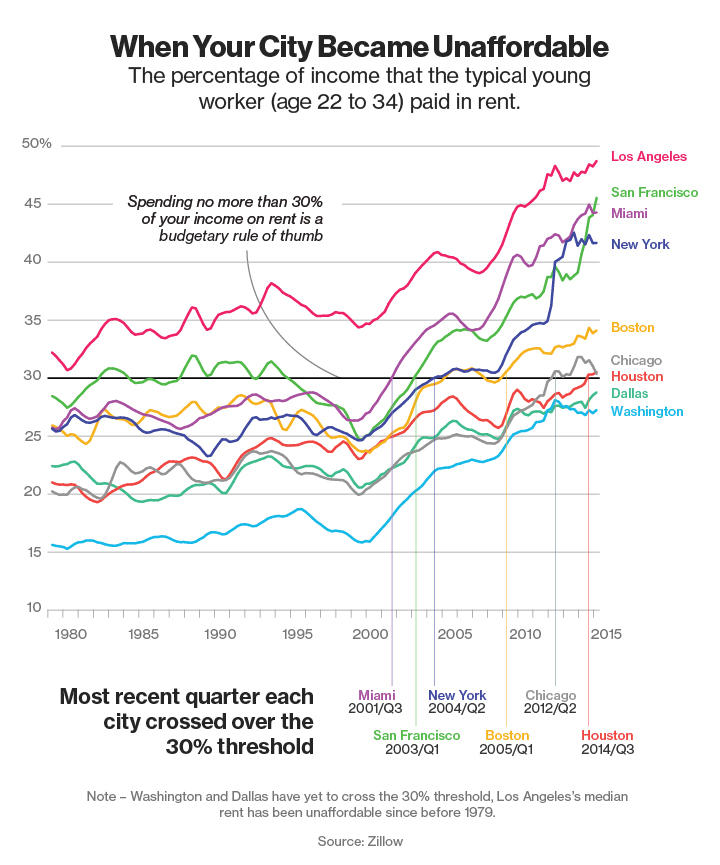
When Major US Cities Became Unaffordable To 22-34 Year Old Workers: Chart
From BloombergBusiness, "The Exact Moment Big Cities Got Too Expensive for Millennials: It wasn't so long ago that cheap rentals in big cities weren't a fantasy" by Patrick Clark:
***
Rents are stretching millennial budgets throughout the U.S. Nationally, the typical worker from 22 to 34 years old paid 30 percent of income for rent in the first quarter of 2015, up from 23 percent in 1979, when the analysis begins. In those places, rental unaffordability is a distinct obstacle for people trying to carve out lives and careers, particularly in the nine major cities shown in the chart below, where more than half of households rent. [Footnote omitted.]
***
Source: BloombergBusiness
Thursday, July 9, 2015
Relative Value Of $100 In The Fifty States: Map
From Tax Foundation, "The Real Value of $100 in Each State" by Alan Cole and Scott Drenkard:
Source: Tax Foundation *** The states where $100 is worth the most are Mississippi ($115.21) Arkansas ($114.29) South Dakota ($114.16) Alabama ($114.03) and West Virginia ($113.12). In contrast, $100 is effectively worth the least in the District of Columbia ($84.96) Hawaii ($86.06) New York ($86.73) New Jersey ($87.34) and California ($89.05.)
Regional price differences are strikingly large; real purchasing power is 36 percent greater in Mississippi than it is in the District of Columbia. In other words: by this measure, if you have $50,000 in after tax income in Mississippi, you would have to have after-tax earnings of $68,000 in the District of Columbia just to afford the same overall standard of living.

Wednesday, July 8, 2015
Fewer Disabled People Are Working Now After Americans with Disabilities Act (ADA) Than Before
From Rasmussen Report, "Wealth Gap" by John Stossel:
...unintended consequence happened with the Americans with Disabilities Act, the well-intended law supported by Democrats and Republicans meant to help more disabled people enter the workforce. But fewer disabled people work now that the law is in effect. Fifty-one percent held jobs when the law passed; now only 32 percent do.
Wednesday, July 1, 2015
The Privilege Myth: Minority First Generation Public College Graduates Do Just As Well In Life As "Privileged" White Private College Graduates: Gallup
From Gallup, "Privilege May Not Be an Advantage for College Graduates" by Brandon Busteed:
If you were asked to predict which of the following two distinct groups of college graduates has the greatest likelihood of succeeding in all aspects of life, how would you answer?
Group 1: Those who are minority, first-generation college graduates and who graduated from public colleges and universities.
Group 2: Those who are white (non-Hispanic), whose mothers and fathers both completed college (mother's education is often used as a proxy for socioeconomic status) and who graduated from private colleges and universities.
It turns out that graduates from the first group are just as likely to end up thriving in all aspects of well-being later in life as graduates from the second group.
Tuesday, June 30, 2015
Price Matters Even When Booking A Clinton To Speak
From The Washington Post, "A college balks at Hillary Clinton’s fee, so books Chelsea for $65,000 instead" by Philip Rucker and Rosalind S. Helderman:
When the University of Missouri at Kansas City was looking for a celebrity speaker to headline its gala luncheon marking the opening of a women’s hall of fame, one name came to mind: Hillary Rodham Clinton.
But when the former secretary of state’s representatives quoted a fee of $275,000, officials at the public university balked. “Yikes!” one e-mailed another.
So the school turned to the next best option: her daughter, Chelsea.
The university paid $65,000 for Chelsea Clinton’s brief appearance Feb. 24, 2014, ....
Friday, June 26, 2015
Taxes On Wine By State
From Tax Foundation, "How High are Wine Taxes in Your State?" by Samantha Jordan and Scott Drenkard:
The treatment of wine differs extensively across the states, and at higher rates than beer because of greater alcohol content. Check out today’s map below to see where your state lies on the wine tax spectrum.
 |
| Source: Tax Foundation |
Kentucky has the highest wine excise tax rate at $3.18 per gallon, followed by Alaska ($2.50), Florida ($2.25), Iowa ($1.75), and New Mexico ($1.70). The five states with the lowest wine excise rates are Louisiana ($0.11), California ($0.20), Texas ($0.20), Wisconsin ($0.25), and Kansas and New York (tied at $0.30). Notably, these rankings do not include states that control all sales.
Subscribe to:
Posts (Atom)