Wednesday, September 3, 2014

Annual Change In US Capital Spending Remains Below Long-Term Trend

From The Wall Street Journal, "U.S. Manufacturing Is Rolling on Aged Wheels: Companies Skimp on Industrial Equipment While Pursuing Deals and Share Buybacks" by James R Hagerty:
Even as economic indicators rise, domestic capital spending has remained anemic by historical standards, especially in manufacturing.
***
The average age of industrial equipment in the U.S. has risen above 10 years, the highest since 1938, economists at Morgan Stanley said in a recent report.

The growth of all types of capital spending by U.S. firms grew just 3% last year, far below the long-term average of more than 8%, Morgan Stanley says. The firm sees only modest improvement ahead: 3.8% growth this year and 5.3% in 2015.
***

Annual Change In Capital Spending
Source: The Wall Street Journal

Monday, September 1, 2014

Adults Consume 200 Extra Calories Per Day When Eating Out At Full Service Or Fast Food Restaurants

From American Cancer Society, "Adults Take In 200 More Calories Per Day When They Eat Out" By Elizabeth Mendes:
When adults in the United States eat out, they are consuming around 200 extra calories per day. This increased intake occurs whether they eat at a full-service or fast-food restaurant.

These findings are from a new study led by American Cancer Society researcher Binh Nguyen, Ph.D., and published online Aug. 7 in the journal Public Health Nutrition. The authors analyzed nationally representative data from surveys of 12,528 adults aged 20 to 64, conducted from 2003 to 2010.

Not only are people taking in more calories when they dine out, but they are also consuming less nutritious food. Adults in the study who ate at a restaurant consumed more saturated fat, sugar, and sodium.

Friday, August 29, 2014

Canada Raises More Corporate Tax Revenue With A Lower Tax Rate Than US With A Higher Tax Rate

From Tax Foundation, "Canada's Lower Corporate Tax Rate Raises More Tax Revenue" by William McBride:
According to OECD data, corporate tax revenue increased following Canada’s corporate tax rate cuts that began in 2000. The first chart below shows the data. Corporate tax revenue as a share of GDP in Canada has averaged 3.3 percent since 2000, while it averaged 2.9 percent over the years 1988 to 2000, when Canada’s corporate tax rate was 43 percent.

Canada Corporate Tax Rate Versus Revenue
Source: Tax Foundation
***
For 15 years straight, Canada has raised more corporate tax revenue than the U.S., as a share of GDP. Since 2000, U.S. corporate tax revenue as a share of GDP has averaged 2.3 percent, compared to 3.3. percent in Canada.

US Corporate Tax Rate Versus Revenue
Source: Tax Foundation

Wednesday, August 27, 2014

Increasing Interest Cost On US Debt Will Account For A Quarter Of The Next Decade's Increase In Federal Expenditures: CBO

AS one can see from slide 4 of CBO's updated presentation on the US budget and economic outlook, interest cost increases on US debt will account for a quarter of all increases of federal outlays over the next decade, according to CBO's projections:

Increase In Federal Outlays: 2014-2024
Source: CBO, slide 4


From Congressional Budget Office, "Press Briefing on An Update to the Budget and Economic Outlook" Presentation, August 27, 2014, by Douglas W. Elmendorf, Director:


Wednesday, August 20, 2014

Routine Pelvic Examinations Not Recommended For Asymptomatic, Non-Pregnant, Adult Women: Health Benefit To Routine Screening Not Found

From Medscape Medical News, "Value of Screening Pelvic Exam for Women Debated" by Lara C. Pullen, PhD:
The American College of Physicians (ACP) has issued new clinical guidelines recommending against screening pelvic examination in asymptomatic, nonpregnant, adult women. The college describes the recommendation as strong, with moderate-quality evidence.
***
ACP has reviewed the literature and determined that the screening pelvic examination does not benefit adult women. Although the recommendations advise against pelvic examinations, the recommendation for Papanicolaou smears remains.
***
The authors reviewed the evidence and found that the harms associated with screening pelvic examination outweigh the benefits. The guidelines also explain that screening for chlamydia and gonorrhoea, sometimes done by pelvic examination, can be reliably performed using nucleic acid amplification tests on self-collected vaginal swabs or urine. “[N]ucleic acid amplification tests on self-collected vaginal swabs or urine have been shown to be highly specific and sensitive, and this technique is supported by several organizations,” the authors write.

In their recommendation, they add, "With the available evidence, we conclude that screening pelvic examination exposes women to unnecessary and avoidable harms with no benefit (reduced mortality or morbidity rates).

Tuesday, August 19, 2014

Low Effective Corporate Tax Rates Masked The True Cost of High Marginal Corporate Tax Rates

As USC Gould School of Law Professor Edward Kleinbard discusses in his paper and as Andrew Ross Sorkin discusses in his DealB%%k Blog post, "Tax Burden in U.S. Not as Heavy as It Looks, Report Says" by Andrew Ross Sorkin, there are tax planning ways to lower the high US corporate marginal tax rate and create a low effective US corporate tax rate on repatriated earnings.

Kleinbard and Sorkin ignore the costs, effort and diversion of resources necessary to achieve the results of low effective tax rates through sophisticated tax and financial planning.

Imagine a world without a corporate tax. A chief financial officer of a corporation with a large overseas holding of cash from foreign profits wants to put the money into a US bank to pay for new plants and equipment in the US. The cfo contacts the foreign bank directly or contacts an overseas subordinate and has the funds electronically transferred to the US account.

Now, imagine a world as it currently is with the US tax code. The cfo must involve tax lawyers, tax accountants and others to insure that the transfer of funds from overseas to the US do not trigger any unexpected and unwanted US corporate taxes. Kleinbard seems to minimize the effort, cost and loss of future borrowing capacity (see excerpt of paper below) of a repatriation tax avoidance scheme that involves the corporation borrowing funds and other devices. What if every time (or just once a year maybe a larger sum) you wanted to write a check or use your debit card to buy something, you had to negotiate for a loan from a bank? Convenient? What if you wanted to borrow funds to buy a house but your outstanding previous bank loan used up part of your available credit and you are denied the loan or are approved for a lower amount? Corporations negotiate loans, and their covenants and have limits on their borrowing capacity.

A high comparative corporate marginal tax rate motivates CEOs and CFOs to engage in sophisticated tax and financial planning. It results in the hiring of extra lawyers, accountants and financial planners and strategists. It increases the risk of IRS tax audits, SEC charges, future back tax payments and tax illegalities. It increases the barriers that must be overcome to move available corporate funds into the US. The comparatively high US marginal corporate tax rate is equivalent to forcing someone to go over a mountain when there is quicker tunnel passage through the mountain. Yes, going over a mountain will get you to the same place as going through the tunnel, but it will increase the effort, time, cost and risk to accomplish something that can be done much more easily.

From "'Competitiveness' Has Nothing to Do with it" by Edward D. Kleinbard, USC Gould School of Law, August 5, 2014:
U.S. firms incur costs to operate their stateless income tax machinery, which is wasteful, but at the same time enjoy an essentially unfettered tax planning environment in which to strip income from high-tax foreign jurisdictions to very low-taxed ones. And this sits on top of transfer pricing, selective leverage of group members, and other devices used to move income that economically is earned in the United States to foreign affiliates.
***
It is true of course that the federal corporate tax rate – nominally, 35 percent – is too high relative to world norms, and that the ersatz territorial system requires firms to waste money in tax planning and structuring, but effective marginal tax rates and overall effective tax rates reach the level of the U.S. headline rate only when firms studiously ignore the feast of tax planning opportunities laid out before them on the groaning board of corporate tax expenditures.
***
large multinational firms often can access their offshore earnings without incurring a tax cost, simply by borrowing in the United States and using the earnings on the offshore cash to pay the interest costs. (The interest earned on a firm’s offshore cash hoard is includible in the U.S. parent’s income as subpart F income, and therefore can be repatriated free of any additional tax cost.) The U.S. parent’s income inclusion on its offshore cash offsets the tax deduction for the interest expense on the firm’s U.S. borrowing, and the firm is left in the same economic position as if it had simply repatriated the cash tax-free (plus or minus a spread for differences in interest rates between the two streams.)

Visual Instructions For Using Chip Embedded Credit Cards

From The Wall Street Journal, "Banks, Retailers Speed Up Drive to Add Chips to Credit, Debit Cards: Data Breaches Spur Effort to Boost Security; End of the Swipe?" by Robin Sidel:
Chip Credit Card Use Instructions
Source: The Wall Street Journal

Wednesday, August 13, 2014

"Nobel Prize Of Mathematics" Awarded To First Woman

From Stanford News, "Stanford's Maryam Mirzakhani wins Fields Medal: Maryam Mirzakhani is the first woman to ever win the Fields Medal – known as the "Nobel Prize of mathematics" – in recognition of her contributions to the understanding of the symmetry of curved surfaces." by Bjorn Carey:
Maryam Mirzakhani, a professor of mathematics at Stanford, has been awarded the 2014 Fields Medal, the most prestigious honor in mathematics. Mirzakhani is the first woman to win the prize, widely regarded as the "Nobel Prize of mathematics," since it was established in 1936.
***
Officially known as the International Medal for Outstanding Discoveries in Mathematics, the Fields Medal will be presented by the International Mathematical Union on Aug. 13 at the International Congress of Mathematicians, held this year in Seoul, South Korea. Mirzakhani is the first Stanford recipient to win this honor since Paul Cohen in 1966.

The award recognizes Mirzakhani's sophisticated and highly original contributions to the fields of geometry and dynamical systems, particularly in understanding the symmetry of curved surfaces, such as spheres, the surfaces of doughnuts and of hyperbolic objects. Although her work is considered "pure mathematics" and is mostly theoretical, it has implications for physics and quantum field theory.

Sunday, August 10, 2014

Farm To Table Is Economically Unsustainable

From The New York Times, "Don’t Let Your Children Grow Up to Be Farmers" by Bren Smith:
AT a farm-to-table dinner recently, I sat huddled in a corner with some other farmers, out of earshot of the foodies happily eating kale and freshly shucked oysters. We were comparing business models and profit margins, and it quickly became clear that all of us were working in the red.

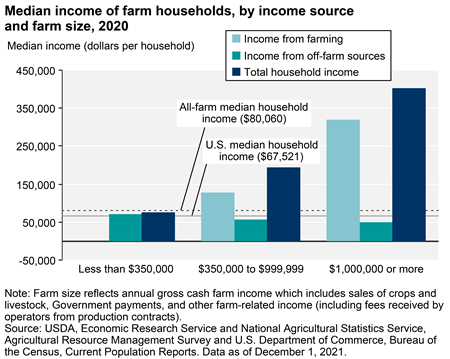
The dirty secret of the food movement is that the much-celebrated small-scale farmer isn’t making a living. After the tools are put away, we head out to second and third jobs to keep our farms afloat. Ninety-one percent of all farm households rely on multiple sources of income. Health care, paying for our kids’ college, preparing for retirement? Not happening. With the overwhelming majority of American farmers operating at a loss — the median farm income was negative $1,453 in 2012 — farmers can barely keep the chickens fed and the lights on.

Others of us rely almost entirely on Department of Agriculture or foundation grants, not retail sales, to generate farm income.
From United States Department of Agriculture, Economic Research Service, "Farm Household Well-being:"

Median Farm Household Income Chart
Source: US Dept of Agriculture


Wednesday, August 6, 2014

Cash For Clunkers Reduced Auto Industry Revenue By $3 Billion And Did Not Increase Auto Sales

From NBER Working Paper Series, "Cash For Corollas: When Stimulus Reduces Spending" by Mark Hoekstra, Steven L. Puller, Jeremy West, Working Paper 20349:
A major objective of the [The Car Allowance Rebate System (CARS), better known as "Cash for Clunkers"] program – and arguably the primary one – was to provide economic stimulus to U.S. vehicle and parts manufacturers (and therefore to the U.S. economy) by shifting expenditures “...from future periods when the economy is likely to be stronger, to the present...” [Romer and Carroll, 2010].
***
However, another priority for the Obama Administration at that time was to improve the fuel efficiency of the U.S. vehicle fleet.... As a result, the policy was written to achieve multiple goals: to accelerate the purchase of new vehicles to increase revenues to the auto industry, and to increase the fuel efficiency of the fleet by requiring new vehicles purchased under the program to have sufficiently high fuel economy.

The fuel efficiency restrictions imposed by the program could have either enhanced or undermined the stimulus effect of the policy. On one hand, lowering the relative price of fuel efficient vehicles might induce buyers to increase spending by selecting vehicles with more expensive fuel-saving technologies, such as hybrids. On the other hand, the restrictions could induce households to purchase smaller, less expensive vehicles in order to meet the fuel efficiency criteria, which would decrease overall new vehicle spending. The net impact of these restrictions on the stimulus effect of the program is an empirical question.
***
[W]e find that although Cash for Clunkers significantly increased new car purchases during the two months of the program, all of this increase represented a shift forward from the subsequent seven to nine months.
***
On net, the program did not result in any more vehicle purchases than otherwise would have occurred over the nine to eleven month period that includes the two program months.
***
[T]he program’s fuel efficiency restrictions could have shifted both the type and price of vehicles purchased, which would have important implications for the program’s effect on auto industry revenues.
***
Strikingly, we find that Cash for Clunkers actually reduced overall spending on new vehicles during the period beginning with the first month of the program and ending eight months after the program. [H]ouseholds tended to purchase less expensive and smaller vehicles such as the Toyota Corolla, which was the most popular new vehicle purchased under the program. Estimates indicate that each household purchasing under the program spent an average of $4,600 less on a new vehicle than they otherwise would have.

Thus, we estimate that this stimulus program – which dispensed three billion dollars in subsidies toward the purchase of 677,000 new vehicles nationally – actually reduced revenues to the auto industry by around three billion dollars over the course of less than one year. This highlights how – even over a relatively short period of time – a conflicting policy objective can cause a stimulus program to instead have a contractionary net effect on the targeted industry. [Emphasis added. Footnotes omitted.]

Monday, August 4, 2014

Since 2000, NYC Payments For Workers' Pensions Increased From 2 Percent To 11 Percent of The City's Budget

From The New York Times, "New York City Pension System Is Strained by Costs and Politics" by David W Chen and Mary Williams Walsh:
For years, New York City has been dutifully pumping more and more money into its giant pension system for retired city workers.

Next year alone, the city will set aside for pensions more than $8 billion, or 11 percent of the budget. That is an increase of more than 12 times from the city’s outlay in 2000, when the payments accounted for less than 2 percent of the budget.

But instead of getting smaller, the city’s pension hole just keeps getting bigger, forcing progressively more significant cutbacks in municipal programs and services every year.

Friday, August 1, 2014

Ancient People Had Clogged Arteries Despite Lack Of Sugar, Fat-laden Diets, Inactivity, Smoking And Widespread Obesity.

From "No TV or Obesity, But Ancient People Still Had Heart Disease: Mummy study shows that, just like today, inflammation spurred blood vessel blockages" on National Institutes of Health, MedlinePlus:
Using CT scans of mummified remains from ancient Egypt, Peru, the Aleutian Islands and the American Southwest, researchers have found evidence of widespread atherosclerosis -- the hardening of heart arteries from fatty substances that build up, eventually leading to heart attack or stroke.

That's despite the fact that those ancient groups were largely free of today's perilous lifestyle factors, such as sugar- and fat-laden diets, inactivity, smoking and widespread obesity.

"Our team has evaluated mummies from five different continents. We have yet to find a culture that didn't have atherosclerosis," said cardiologist Dr. Gregory Thomas, the lead author of a review published in the current issue of the journal Global Heart.

Tuesday, July 29, 2014

Uncertainty Band For CBO's Projection Of Federal Debt: 2039 Federal Debt As Percent Of GDP Could Be 43 Percent Higher Or A Third Lower

From The Congressional Budget Office, "The Uncertainty of Long-Term Budget Projections" Posted by Jonathan Huntley on July 29, 2014:
In CBO’s analysis, the ranges of variation for the four factors were based on the historical variation in their 25-year averages, as well as on consideration of possible future developments; together, those offer a guide (though admittedly an imperfect one) to the amount of uncertainty that surrounds projections of the factors over the next 25 years.

The budgetary effects of varying the individual factors differ widely. The simulated variations in productivity, interest rates, and Medicare and Medicaid spending have large effects on the budget within 25 years, whereas the simulated variation in mortality rates does not. In particular:

  • In cases in which only one of those factors varies from the values used for the extended baseline, CBO’s projections of federal debt held by the public in 2039 range from about 90 percent of gross domestic product (GDP) to 135 percent, compared with 111 percent under the extended baseline including the economic effects of future fiscal policies.
  • In a case in which all four factors varied simultaneously so as to increase projected deficits, but they vary only half as much as in the individual cases, federal debt held by the public in 2039 would reach about 160 percent of GDP (see the figure below). Conversely, in a case in which all four factors varied in a way that lowered deficits, debt in 2039 would equal 75 percent of GDP, about what it is now.

Those projected levels of debt are all high by historical standards, and a number of them exceed the peak of 106 percent of GDP that the United States reached at the end of 1946.

Factors Affecting Federal Debt Levels
Source: CBO

Wednesday, July 9, 2014

2007 To 2013 Multifactor Productivity Annual Growth Rate Below Longer Term Average: 0.6 Percent Versus 0.9 Percent Annual Growth

From The Bureau of Labor Statistics, Economic News Release, "Multifactor Productivity Trends News Release:"
Multifactor productivity measures the change in output per unit of combined capital and labor input. It is designed to measure the joint influences of technological change, efficiency improvements, returns to scale, reallocation of resources, and other factors on economic growth, allowing for the effects of capital and labor. Multifactor productivity, therefore, differs from labor productivity (output per hour worked) measures that are published quarterly by BLS. Multifactor productivity includes information on capital services, hours worked, and shifts in the composition of labor. Estimates of capital services and labor composition are not included in the quarterly labor productivity measures. Additionally, much of the source data needed to construct multifactor productivity measures are not available quarterly.
***
Historical trends in the private nonfarm business sector

Multifactor productivity in the private nonfarm business sector grew 0.9 percent annually from 1987 to 2013. (See table A.) For the 2007-2013 period, multifactor productivity grew 0.6 percent on average as combined inputs increased 0.4 percent and output increased 1.0 percent. The increase in combined inputs reflected a decrease in labor input of 0.1 percent combined with a 1.4-percent increase in capital services. In contrast, the 0.9-percent average annual percent change in multifactor productivity from 1987 to 2013 was a result of output growing 2.9 percent and combined inputs increasing 2.0 percent. (See table 1.)

Monday, July 7, 2014

Low-Wage Workers And Low-Income Families Are Not The Same: A Small Percentage Of A Higher Minimum Wage Goes To Poor Families

From The Wall Street Journal, "Who Really Gets the Minimum Wage: Obama's $10.10 target would steer only 18% of the benefits to poor families; 29% would go to families with incomes three times the poverty level." by David Neumark:
One might think that low-wage workers and low-income families are the same. But data from the U.S. Census Bureau show that there is only a weak relationship between being a low-wage worker and being poor, for three reasons.

First, many low-wage workers are in higher-income families—workers who are not the primary breadwinners and often contribute a small share of their family's income. Second, some workers in poor families earn higher wages but don't work enough hours. And third, about half of poor families have no workers, in which case a higher minimum wage does no good. This is simple descriptive evidence and is not disputed by economists.
***
Using data from the Current Population Survey for recent years, my graduate student Sam Lundstrom has calculated that if we were to raise the minimum wage to $10.10 nationally, 18% of the benefits of the higher wages (holding employment fixed) would go to poor families. Twenty-nine percent would go to families with incomes three times the poverty level or higher.

What about minimum wages as high as $15 an hour? A higher minimum obviously affects more workers. But because workers at higher wages are even less likely to be in poor families, the targeting only worsens with a higher minimum wage. For example, applying the same calculation as above for a $15 per hour minimum, the share of benefits going to poor families would decline to 12%, and the share to families more than three times the poverty line would increase to 36%. And this does not account for the sizable employment losses that would likely result from such a large minimum-wage increase.

Wednesday, June 18, 2014

CBO's Projections Of Per Capita GDP 2014 To 2024

From Congressional Budget Office, "CBO's Projections of GDP Per Capita" posted by Doug Elmendorf on June 18, 2014:
Many factors, including per capita GDP, affect Americans’ standard of living. Although CBO has not analyzed all of those factors or their effects, the agency projects that real GDP per capita will grow, on average, by about 2 percent per year between 2014 and 2017, when it is expected to return to its historical relationship with the economy’s potential output (see the table below). CBO projects that, after 2017, real GDP will grow at the same rate as potential GDP—by an average of about 2¼ percent per year during the 2018–2024 period—because the agency does not attempt to predict the timing or magnitude of business cycle fluctuations in the economy so far into the future. With the population expected to grow by about 1 percent per year, real GDP per capita is projected to grow, on average, by about 1¼ percent per year between 2018 and 2024—a slower rate than the annual average rate of about 2 percent since 1950. That difference reflects CBO’s projection that real GDP will grow more slowly over the latter part of the projection period than it has in the past several decades, primarily because of slower growth of the labor force stemming from the retirement of the baby boom generation.

CBO's Projections of Real GDP Per Capita, 2014 to 2024
(Thousands of 2009 dollars)
GDP Per CapitaPercentage Change From Prior Year
201450.91.9
201552.02.2
201653.22.2
201754.01.6
201854.81.4
201955.51.3
202056.11.2
202156.81.2
202257.51.2
202358.21.2
202458.81.1
Note: Projections are for the fourth quarter of each calendar year.
Real GDP = gross domestic product adjusted to remove the effects of inflation.

Saturday, June 14, 2014

Inane Licensing Laws Immigrants And Small Businesses Face: Is Anything Other Than A Bureaucrat's Job Protected?

From The New York Times, "Selling Baubles on the Street: License Required" by Emily S Rueb:
She showed the officer the city-issued license belonging to her husband. “Husband come,” she told the officer, using the few English words she knew. But her husband was not there. So Ms. Yin, 48, was arrested and charged with selling without a license for about the 30th time in over a decade.

Ms. Yin’s husband, Chee Fei Cheng, has one of New York City’s coveted general vending licenses, of which there are only 853 available to nonveterans. When her husband had a stroke in 2000, Ms. Yin had to support their family on her own, but city laws said vendors could not let someone else sell under their licenses, not even a family member.

The couple and local officials wrote letters to the Department of Consumer Affairs asking to transfer the license to Ms. Yin. But the legal mechanism for a transfer had not been clear or utilized, and the waiting list for a license, with more than 1,800 names, has been closed since 1993. So for more than a decade, Ms. Yin has been repeatedly arrested, and has had to pay fines and clean parks and restrooms as punishment for selling without a license.

Thursday, June 12, 2014

On Average, Private Industry Health Insurance Employer Costs Are 7.9 Percent Of Compensation

From US Department of Labor, Bureau of Labor Statistics, Economic News Release, "Employer Costs for Employee Compensation - March 2014":
Health insurance costs in private industry

The average cost for health insurance benefits was $2.36 per hour worked in private industry (7.9
percent of total compensation) in March 2014. In March 2004, employer costs for health benefits
averaged $1.53, or 6.6 percent of total compensation.
***
Employer costs for health insurance benefits were significantly higher for union workers, averaging $5.54 per hour worked (12.6 percent of total compensation), than for nonunion workers, averaging $2.04 (7.1 percent).

Tuesday, June 10, 2014

Households With Similar Incomes And Parental Education Levels, Across All Race And Ethnic Groups, Have Essentially The Same Higher Education Expenditure Levels

From US Dept of Labor, Bureau of Labor Statistics, Beyond the Number, "Do different groups invest differently in higher-education?" by Tian Luo and Richard J. Holden:
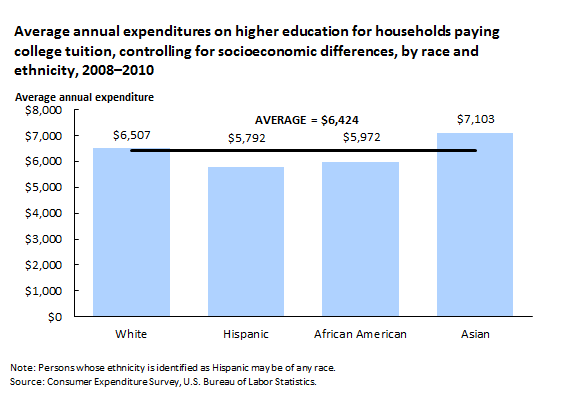
When we analyzed the households with a college student with a tuition expenditure, and accounted for the household income and education level of the parents, we found that the differences in tuition expenditures between races and ethnicities converge. For college students with tuition expenditures who have parent(s) with a bachelor’s degree and a median annual income of $70,000, Hispanics and African American households had tuition expenditures that were only 11 and 8 percent lower, respectively, than those made by White households, while Asians had 9 percent higher tuition expenditures than White households. (See chart 3.)
CHART 3
Household Tuition Expenditures
Source: US Bureau of Labor Statistics

However, these much smaller differences in tuition expenditures are not actually statistically significant. In other words, when you compare families with similar household incomes and parental education levels, the higher education expenditure levels are essentially the same across all race and ethnic groups. As parents' education and income level increase, so do the expenditures for higher education. From another perspective, socioeconomic differences, not differences in race or ethnicity, have a greater influence on how families value higher-education investments.