Source: The Wall Street Journal
Those receiving government payments last month represented less than 28% of all unemployed Americans, according to an analysis of Labor Department data. That figure is down from 31% a year earlier. And it’s well below the 67% who received the assistance in September 2010, when emergency federal programs extended benefits beyond the 26 weeks granted in most states, to as long as 99 weeks.*** When benefits expire, unemployed workers frequently face two likely outcomes: They accept lower-paying work or they drop out of the labor force. Both choices were common among those who lost benefits in North Carolina in 2013.
Those who drop out might have found that it makes financial sense to retire, return to school, stay at home to care for children or older adults, or seek out other forms of government assistance. Each of those choices could remove a person from the labor force. The labor-force participation rate has been trending at the lowest levels since the 1970s.
Tuesday, October 6, 2015
Only 28 Percent Of The Unemployed Receive Government Benefit Payments: Down From 67 Percent In 2010
From The Wall Street Journal, Real Time Economics, "Less Than a Third of Unemployed Americans Get Benefit Checks" by Eric Morath:


Monday, October 5, 2015
World Poverty At Record Low
From BloombergBusiness, "Extreme Poverty in the World Is About to Hit a Record Low: We're one step closer to eradicating extreme poverty by 2030" by Andrew Mayeda:
Source: BloombergBusiness
Almost half of the world’s extreme poor live in sub-Saharan Africa, according to the 2015 projection. That's up from about 15 percent in 1990. By contrast, there have been dramatic declines in poverty in East and South Asia over the same period as China and India emerged as economic powers.
“In the areas where there are large numbers of people living in extreme poverty, extreme poverty has deepened and become more embedded,” said Kim.
In addition to the new projection, the World Bank raised its definition of extreme poverty to income of $1.90 per day, from $1.25. The new poverty line adjusts for inflation using 2011 prices that account for purchasing power as a baseline.

Saturday, October 3, 2015
Past Banking Runs, Crises And Failures Were Not Stopped By Stricter Mortgage Lending And Higher Bank Equity
My comment posted to The Wall Street Journal, Opinion Commentary, "How Not to Prevent the Next Financial Meltdown: Dodd-Frank’s safeguards against chaos are based on a misdiagnosis of what led to the 2008 crisis." by Edward P Lazear:
100 years ago national banks and some state banks were prevented from making mortgage loans. Banks that could make mortgages required a buyer to put 50 percent down and to payoff the mortgage in 3-5 years. Bank crises occurred anyway.
The older, more stringent lending requirements did not stop bank runs, bank failures, or, in the 1930s, mortgage defaults and foreclosures. Tough mortgage lending decreases the availability of mortgages and limits home purchases.
Increasing the number of loans requires increasing available bank funding through equity or debt.
Many publicly traded banks regularly trade below book value, which means a bank cannot earn enough in its business to attract and compensate equity owners for the risk, and limits its ability to issue equity. To increase the equity ratio, banks usually shrink loan assets. More debt is easier.
Without FDIC, TBTF [Too Big To Fail], GSEs [GNMA, FNMA, etc.], or securitization, many in the middle class would not get mortgages because banks could not get funding for home loans.
Thursday, October 1, 2015
Women Make Different Work Choices Than Men: My Comment To Wall Street Journal Wage Gap Myth Commentary
My comment to The Wall Street Journal Opinion Commentary, "The ‘Wage Gap’ Myth That Won’t Die: You have to ignore many variables to think women are paid less than men. California is happy to try." by Sarah Ketterer:
For years, federal and state laws have prohibited gender wage discrimination within a company. These wage laws are enforceable by the government and private lawsuits. Despite claims that a substantial number of women in the workforce are paid about 20 percent less than men, there are few, if any, private or government wage discrimination legal actions and most find the company did not discriminate. Why aren't women suing in huge numbers and why do the few who sue lose, if the discrimination is real?
Within most companies, there is no gender wage discrimination. The statistic only appears when one compares wages across different companies and industries. The gap statistic cited excludes the value of benefits, workers' experience and work environments. Companies are different. Higher paid work with higher work injury rates, frequent unscheduled overtime, overnight travel, fewer days off and lower benefit value attract fewer women than men.
Women choose work differently than men.
Wednesday, September 23, 2015
Number Of Work Hours Needed To Buy An IPhone 6 In Different Cities Internationally
From The Wall Street Journal, Real Time Economics. "The Most Expensive Place in the World to Live" by Nick Timiraos:
Source: The Wall Street Journal, Real Time Economics
New Yorkers, for example, need to work around 24 hours to make enough money to buy an iPhone 6. That’s up from 20.6 hours for residents of Geneva, but much lower than 163.8 hours for residents of Shanghai or 334.2 hours for residents of Manila.

Tuesday, September 22, 2015
Non-Bank Lenders Take Biggest Share Of Mortgages Since 1995
From The Wall Street Journal, "Number of New Mortgages in 2014 Plunges 31% From Year Before: Nonbank lenders accounted for biggest share of lending since at least 1995" by Joe Light:
Nonbank lenders in 2014 took their biggest share of the mortgage market since at least 1995, new data show, as several large banks pulled back on lending to all but the most pristine borrowers.
According to federal government data released Tuesday, nondepository independent mortgage companies in 2014 accounted for 47% of loans to buy homes for owner-occupants and 42% of refinancing loans. Those market shares increased from 43% and 31%, respectively, in 2013.
The home-purchase share last year was 12 percentage points higher than in 2010.
Saturday, September 19, 2015
Map Of Areas Of US That Most Benefit From Deduction For State And Local Taxes
From Tax Foundation, "The Biggest Loser of the Presidential Campaign So Far: the State and Local Tax Deduction" by Alan Cole:
[T]he deductibility of state and local taxes (including property taxes) is expected to result in $81 billion of lost revenue for the federal government in 2015, according to the latest OMB estimates. For another, the policy only benefits particular kinds of taxpayers. For example, it benefits those who itemize their deductions, rather than opting for the standard deduction. This is often characterized as regressive, because itemizers tend to be much wealthier than those who take the standard deduction. Furthermore, its value often varies heavily from place to place. This can be seen on a map we recently published of the values of state and local deductions taken per return.
Source: Tax Foundation
This policy is a kind of ad-hoc, incomplete, and arbitrary subsidy for state and local tax revenues. It benefits federal taxpayers extremely unequally, and it costs a lot of money that could be used for lower rates.

Wednesday, September 16, 2015
Low Income And Wealthier Children Eat About The Same Percentage of Fast Food Calories: Casting Doubt That Fast Food Causes Obesity In The Poor
From BloombergBusiness, "Rich Kids Eat a Ton of Fast Food Too: Income doesn't matter." by John Tozzi:
Kids from low-income families are more likely to be obese than wealthier children, research suggests. But the relationship is complex, and scientists are still trying to untangle the links between income and such factors as diet and exercise that contribute to obesity.
New data make those connections even more complicated. Low-income kids—from households earning less than $31,500 for a family of four—got about the same percentage of their calories from fast food as wealthier kids, according to a federal survey of more than 5,000 people, including children of all ages, from the Centers for Disease Control (CDC).
***
Source: BloombergBusiness
Other recent research has questioned the notion of food deserts' role in diet and weight. In Los Angeles, for example, little evidence supports the idea that living near junk food outlets increases obesity rates, according to another recent CDC study.

Friday, September 11, 2015
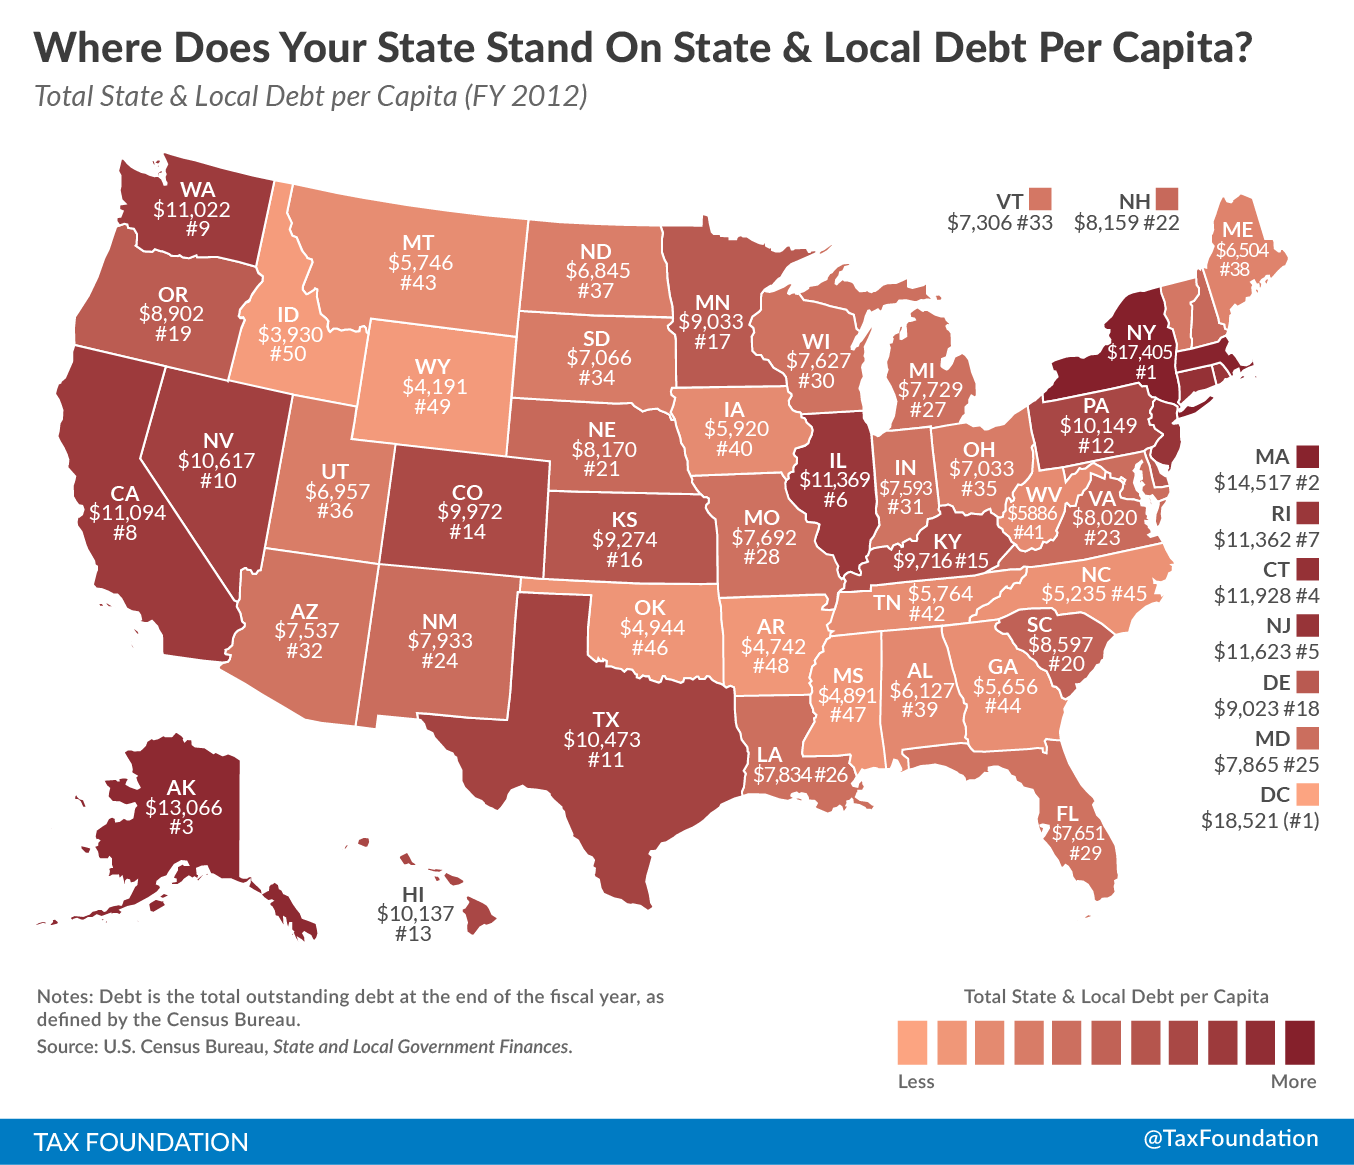
NY Has The Highest State And Local Debt Per Person; Followed By Massachusetts
From Tax Foundation, "Where Does Your State Stand on State & Local Debt Per Capita?" by Jared Walczak and Liz Malm:
 |
| Source: Tax Foundation |
States with the highest amount of state and local debt per capita in the 2012 fiscal year (the most recent data available from the Census Bureau) were New York ($17,405 per person), Massachusetts ($14,517 per person), Alaska ($13,066 per person), Connecticut ($11, 928 per person), and New Jersey ($11,623 per person).
On the other end of the spectrum, states with the lowest state and local debt per capita were Idaho ($3,930 per person), Wyoming ($4,191 per person), Arkansas ($4,742 per person), Mississippi ($4,891 per person), and Oklahoma ($4,944 per person).
Chart Of Number Of US Children Born To Illegal Immigrants: 1992-2013
From The Wall Street Journal, "Fact-Checking the Figures on ‘Anchor Babies’: Note to presidential candidates: Estimate of some 400,000 such births is outdated" by Jo Craven McGinty:
Still, the numbers disturb Mr. Trump and others who favor cracking down on illegal immigration because as citizens, these children automatically get access to education, health care and other services. At age 21, they can also apply for legal status for their undocumented parents and siblings, which is why critics refer to them as anchors.
For those and other reasons, different groups have tried to pin down their number. The Migration Policy Institute, the Center for Migration Studies and the Pew Research Center, in addition to the Center for Immigration Studies, have all published estimates.
The figures peaked in 2007-10. In that span, the Migration Policy Institute put the high number at 321,000; the Center for Migration Study pegged it at just under 350,000; and the Pew Research Center put it at 370,000.
The numbers vary because each group uses a slightly different approach.***
Source: The Wall Street Journal

Unionized Workers Significantly Less Satisfied Than Non-Union Employees With Job Security, Workplace Safety, Supervisor, Recognition, Hours Flexibility
From Gallup, "Union Members Less Content With Safety, Recognition at Work" by Andrew Dugan:
In the U.S., employed Americans who report being members of labor unions are significantly less likely than nonunion employees to say they are "completely satisfied" with six of 13 job aspects. These include workplace safety, recognition for accomplishments, flexibility of hours and job security. In only one job aspect, employer-provided health insurance, are union workers significantly more likely than nonunion workers to say they are completely satisfied.
Wednesday, September 9, 2015
New Start-Up Businesses Are A Declining Share Of US Companies And US Employment Over The Past 35 Years
From The Wall Street Journal, "Starting a Business is Easy (for Harvard Business Grads)" by Jeffrey Sparshott:
But separate Commerce Department data show startups–firms less than a year old–make up a significantly smaller share of all companies and employment than during 1980s or 1990s. The authors worry that may be limiting one historical path to the middle class.
Source: The Wall Street Journal
Source: The Wall Street Journal


Thursday, September 3, 2015
Making The Case That Humanities Majors Make Better Programmers
From the Atlantic, "You Don't Have to Be Good at Math to Learn to Code: Learning to program involves a lot of Googling, logic, and trial-and-error—but almost nothing beyond fourth-grade arithmetic." by Olga Khazan:
In order to figure out what your program should say, you’re going to need some basic logic skills. You’ll also need to be skilled at copying and pasting things from online repositories and tweaking them slightly. But humanities majors, fresh off writing reams of term papers, are probably more talented at that than math majors are.
I know plenty of people with bachelor’s, master’s, and even doctorate degrees in philosophy or international relations who have taught themselves to code. It’s true that some types of code look a little like equations. But you don’t really have to solve them, just know where they go and what they do. The programmer and entrepreneur Emma Mulqueeny puts it well:
In most cases you can see that the hard maths (the physical and geometry) is either done by a computer or has been done by someone else. While the calculations do happen and are essential to the successful running of the program, the programmer does not need to know how they are done.
Wednesday, September 2, 2015
Highest US Entrepreneurship Rate In At Least 16 Years
From MarketWatch, "Entrepreneurship study finds highest recorded levels" by Caitlin Huston:
Entrepreneurship in the United States is at its highest rate in at least 16 years, a new study reports.
According to a study released Wednesday by Babson College and Baruch College, 14% of the United States working age population, about 24 million people, reported being entrepreneurs in 2014. But they weren’t all like Mark Zuckerberg starting Facebook in a Harvard dorm — 6.5% were forming businesses within established companies and 11% were between the ages of 55 and 64, the highest rate of entrepreneurship activity for that age group among 29 developed economies in the study.
The results were the strongest since the colleges began the study in 1999. The study surveys a representative sample of the U.S. population to extrapolate the results and defines entrepreneurship as businesses less than 3.5 years old.
Tuesday, September 1, 2015
Highest Student Loan Default Rates For Borrowers With Lowest Debt Amounts
From The New York Times, The Upshot, "Why Students With Smallest Debts Have the Larger Problem" by Susan Dynarski:
*** Defaults are concentrated among the millions of students who drop out without a degree, and they tend to have smaller debts. That is where the serious problem with student debt is. Students who attended a two- or four-year college without earning a degree are struggling to find well-paying work to pay off the debt they accumulated.***
Source: The New York Times
Most borrowers have small debts, according to the Federal Reserve Bank of New York; 43 percent borrowed less than $10,000, and 72 percent less than $25,000. And borrowers with the smallest debts are most likely to default. Of those borrowing under $5,000 for college, 34 percent end up in default. The default rate steadily drops as borrowing increases. Among the small group (just 3 percent) of those borrowing more than $100,000, the default rate is just 18 percent.
What does this all mean for loan policy? Getting students to borrow less is not an obvious path to reducing default, since 51 percent of defaulters left college with less than $10,000 in student loans.

Monday, August 31, 2015
Most Profitable Private US Businesses Ranked By Profit Margins
From Sageworks, Data Releases, "The Most Profitable Industries in the US:"
Sageworks today released its annual ranking of the most profitable industries in the U.S. Accounting firms, real estate lessors, and auto equipment leasing were at the top of the list. Companies operating in these three industries are seeing average net profit margins greater than 15 percent, or more than double the private-company average. Also well-represented on the list are companies in the professional services sector and industries related to renting/leasing and health care. A separate ranking of the most profitable small business industries is also included in this report. This list focuses on businesses with less than $5 million in annual revenue.
The analysis in this report is based on private-company financial statements filed over the 12 months ended August 27th, 2015. and uses net profit margin as the metric by which each industry is ranked. Net profit margin has been adjusted to exclude taxes and include owner compensation in excess of their market-rate salaries -- adjustments commonly made to private-company financials in order to provide a more accurate picture of the companies’ operational performance.
The Most Profitable Industries In The U.S.
Source: Sageworks *** With a few exceptions (warehousing, support activities for mining), the list of most profitable small business industries very closely mirrors the overall ranking. The full small business list, which focuses on companies with less than $5 million in annual revenue, is included below.
The Most Profitable Small Biz Industries In The U.S.
Source: Sageworks


Thursday, August 27, 2015
Is The SEC Violating Public Company Commercial Free Speech Rights By Regulating Interim Operating Results Disclosure?
My posted comment to The Wall Street Journal, "Let Tim Cook Speak (About Business): Apple’s CEO becomes a target of regulatory action for reminding investors that the real world exists." by Holman W Jenkins, Jr:
When the SEC was created in the 1930s, our free speech rights were more limited and government was allowed to enact laws restricting free speech. It is really only since the 1960s that our current view of expansive free speech was approved by the US Supreme Court.
In 1976, the US Supreme Court said commercial speech has first amendment protection and in 1980, the court set out a four part test when commercial speech can be regulated.
A first amendment challenge to laws and SEC rules limiting public companies from disclosing material information about their current operating results, which are necessary for the real-time accurate pricing of publicly traded securities, would give the US Supreme Court a chance to balance the rights of investors to have current and timely information to price securities against the government's right to delay disclosure for market regulatory reasons. A court could easily find that the SEC has overreached and its disclosure prohibitions are too broad.
Tuesday, August 25, 2015
Cities Passing Higher Minimum Wage Are Exempting Unions From Requirement: Allowing Unions, But Not Non-Unionized Businesses, To Negotiate A Lower Starting Wage For New Members
From The Wall Street Journal, "More Minimum-Wage Backfires: Wal-Mart earnings dip, while unions win wage-law exemptions." in Opinion:
The campaign for higher minimum wages continues to inflict damage on business employees and owners. About the only ones not feeling the pain are the labor unions that back this movement. Meanwhile, in a growing number of U.S. jurisdictions, unions are succeeding in exempting themselves from the laws they seek to impose on everyone else.*** But don’t expect pity from the leaders of organized labor, who are busy making sure they don’t have to play by the rules they’re demanding for everyone else. Cities including Chicago, Milwaukee, San Francisco and San Jose have exempted union contracts from laws mandating higher minimum wages.
Union chiefs say the laws unduly limit their flexibility to negotiate labor contracts, which are governed by federal law. And perhaps they don’t care what the wage is so long as they can collect dues. Or maybe they want the ability to give higher wages to longtime union members while dictating lower pay for new members. Flexibility on wages could also be a useful tool to persuade management to accept a unionized workforce, with a demand for higher pay coming later. But why shouldn’t workers who choose not to join a union enjoy the same freedom?
Saturday, August 22, 2015
Comparison Of Federal Reserve GDP Projections Versus Actual GDP: GDP Bonds Anyone?
From The Wall Street Journal, Opinion, "A Fine Fed Mess: Are financial assets falling to match the slowing real economy?"
Market-Based Solutions
There are market-based solutions that would improve the forecasts of GDP, that do not involve model building or a dependency on a particular school of economics. Event-based financial instruments where the amount of the payout is directly and computationally dependent on observable economic indicators, observable prices or observable outcomes, such as election outcomes in the Iowa Electronic Markets, inflation forecasts of US Treasury TIPS and other prediction-based actively traded instruments are more accurate than model-based forecasts.
A US Treasury GDP bond of different maturities, where payouts are computationally dependent on actual reported GDP of different time periods, would allow for the computation of future expected (forward) GDP growth rates. These forward growth rates, if they behave like other prediction market-based forecasts, will have greater accuracy than any model based forecast, including a Federal Reserve model.
One has to wonder why the Federal Reserve has not promoted the idea of a market-based, GDP dependent, financial instrument to improve the accuracy of its GDP forecast and to allow for computation of expected GDP growth rates for many different future time periods. Is it a fear of immediate accountability and feedback? The ability of investors to read real-time, market-based forecasts of the future of the US economy from a GDP-based bond would provide a level of oversight, feedback and accountability to the Federal Reserve's actions and judgments to improve future GDP growth that the Federal Reserve is not used to having.
Source: The Wall Street Journal

Market-Based Solutions
There are market-based solutions that would improve the forecasts of GDP, that do not involve model building or a dependency on a particular school of economics. Event-based financial instruments where the amount of the payout is directly and computationally dependent on observable economic indicators, observable prices or observable outcomes, such as election outcomes in the Iowa Electronic Markets, inflation forecasts of US Treasury TIPS and other prediction-based actively traded instruments are more accurate than model-based forecasts.
A US Treasury GDP bond of different maturities, where payouts are computationally dependent on actual reported GDP of different time periods, would allow for the computation of future expected (forward) GDP growth rates. These forward growth rates, if they behave like other prediction market-based forecasts, will have greater accuracy than any model based forecast, including a Federal Reserve model.
One has to wonder why the Federal Reserve has not promoted the idea of a market-based, GDP dependent, financial instrument to improve the accuracy of its GDP forecast and to allow for computation of expected GDP growth rates for many different future time periods. Is it a fear of immediate accountability and feedback? The ability of investors to read real-time, market-based forecasts of the future of the US economy from a GDP-based bond would provide a level of oversight, feedback and accountability to the Federal Reserve's actions and judgments to improve future GDP growth that the Federal Reserve is not used to having.
Friday, August 21, 2015
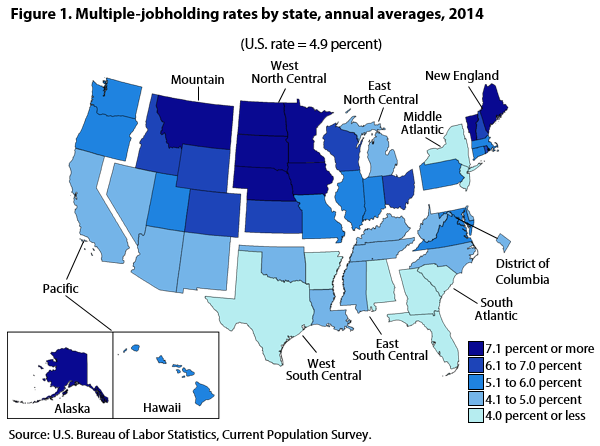
Multiple Job Holding Rates By State: Map
From Bureau of Labor Statistics, Monthly Labor Review, "Multiple jobholding in states in 2014: Multiple-jobholding rates at the state and regional levels vary considerably from the national average." by Susan Campolongo:
In 2014, the multiple-jobholding rate (the percentage of individuals who hold more than one job) in individual states varied considerably from the national average of 4.9 percent, a rate that has been unchanged since 2010. (See figure 1 and table 1.) In all, 22 states had multiple-jobholding rates significantly higher than the national average, 11 states had significantly lower rates, and 17 states and the District of Columbia had rates that were not significantly different from the U.S. average.
"
Source: Bureau of Labor Statistics
[Table 1 omitted.]
Multiple-jobholding rates tended to vary by region. As in past years, northern states generally had higher rates than southern states. All states in the West North Central Census division and all but one of the states in the New England division had multiple-jobholding rates significantly higher than the U.S. average. Seven of the eleven states with multiple-jobholding rates significantly below the national average were located in the South region. [Footnotes and tables omitted.]
Subscribe to:
Posts (Atom)