Is growing inequality the fault of capitalism, of a growing ability of American firms to exploit their workers, or of increasing greed? Both the international and domestic evidence is inconsistent with those explanations. In fact, the growing wage gap seen in the US is common to most developed economies. Top earners have enjoyed higher wage growth than the median worker throughout the OECD countries. A subset of institutionally and political diverse countries, including the United Kingdom, Germany, Denmark, Sweden, Norway, Finland, Switzerland, Australia, New Zealand and Canada among others, have all experienced growing wage inequality similar to that seen in the United States. If such varied countries — some of which are held out as examples of the social-democratic ideal — are all seeing growing wage dispersion, it is unlikely that capitalism, increased monopoly power, or growing greed is the cause.
If not capitalism per se, what is the explanation for growing wage inequality? The answer is increasing dispersion in labor-market productivity. In labor markets where firms must compete with one another to hire and retain workers, wages tend to reflect a worker’s productivity. The evidence supporting this linkage is strong. If wages at the bottom are not growing as rapidly as wages at the top, perhaps productivity among the least skilled workers is not growing as rapidly as productivity among the most skilled workers. In fact, that is exactly what appears to be happening.
Industries vary in their use of skilled workers. For example, in the Bureau of Labor Statistics’ “Apparel Manufacturing” industry, the average level of education is 11.7 years. In “Information Services and Data Processing Services,” it is 15.5 years. Those industries that have the most educated workers have the highest levels of productivity measured as total value added per hour worked. Those same industries also tend to have witnessed the greatest growth in productivity over the past two decades. In fact, the differences in productivity growth between educated and less-educated workers far outstrips the differences in wage growth between educated and less-educated workers. This evidence suggests that wages are lagging for the lowest half of American workers primarily because productivity growth is lagging for those workers.
Tuesday, August 4, 2020
Growing Wage Gap In Developed Economies, Not Just US: Skill Inequality From Workers' Education And Productivity Growth Differences Are Cause
From National Review, Capital Matters, The Economy, "Growing Wage Inequality Is Caused by Growing Skill Inequality" by Edward P. Lazear:

Sunday, July 26, 2020
Open Schools: My Comment To WSJ, "A Phase-Four Flop"
My published comment to The Wall street Journal opinion, "A Phase-Four Flop: The latest proposals have everything but a growth agenda." by The Editorial Board:
A lot said about the coronavirus can be said about the flu. The flu kills old people and those with serious comorbidities. The flu hospitalizes many and some need ventilators. Put old people with the flu into nursing homes and assisted living, the flu infection and death rates will increase. Having the flu is a horrible experience. Flattening the curve with lock downs, etc was never meant to stop Covid-19. It was used successfully to spread cases into the future to ease the hospital burden. Reopening is allowing the delayed infections to happen now, as we see with mostly younger people with a low death rate. Many more children die from the flu than from coronavirus. It is more deadly for kids to go to school in a flu season then now. Children need bacterial and viral exposure for a healthy adult immune system. Kids need school to learn, and socialize. Poor kids need school meals. Schools are babysitters that parents need to be able to go back to work.
Thursday, July 23, 2020
Standardized Ranking Of Coronavirus Cases And Deaths By 1M Population
The 50 US States plus the District of Columbia are ranked below by cases per 1 million population and deaths per 1 million population. The data is from Worldometer. Per 1 million ranking is a standardized and fairer comparative indicator of the impact of Coronavirus at the local level.
For example, Florida is ranked fifth in cases per 1 million population, but ranked 24th in deaths per 1 million population. Texas is ranked 18th in cases per 1 million population, and ranked 33rd in deaths per 1 million population.
New York is ranked first in cases per 1 million population, and ranked 2nd in deaths per 1 million population. New Jersey is ranked 4th in cases per 1 million population, but ranked first in deaths per 1 million population.
Of course, these number will change over time as more cases occur and more deaths happen.
Cases Per 1 Million Population Ranking

Deaths Per 1 Million Population Ranking

For example, Florida is ranked fifth in cases per 1 million population, but ranked 24th in deaths per 1 million population. Texas is ranked 18th in cases per 1 million population, and ranked 33rd in deaths per 1 million population.
New York is ranked first in cases per 1 million population, and ranked 2nd in deaths per 1 million population. New Jersey is ranked 4th in cases per 1 million population, but ranked first in deaths per 1 million population.
Of course, these number will change over time as more cases occur and more deaths happen.
Cases Per 1 Million Population Ranking

Deaths Per 1 Million Population Ranking

Wednesday, July 8, 2020
Low-Income Consumer Spending Rebounds To Pre-Crisis Levels
From The Wall Street Journal, "The Daily Shot: Spending by Low-Income Consumers Is Back to Pre-Crisis Levels" by Lev Borodovsky:
4. Spending by low-income consumers is back to pre-crisis levels.
 |
| Source: WSJ The Daily Shot Source: Hugo Ste-Marie, Portfolio & Quantitative Strategy Global Equity Research, Scotia Capital |
Tuesday, July 7, 2020
Gross Domestic Product by State, 1st Quarter 2020: Bureau of Economic Analysis
From Bureau of Economic Analysis, "Gross Domestic Product by State, 1st Quarter 2020: Decreases in All States and the District of Columbia in the First Quarter":
Link to PDF of full news release plus tables.
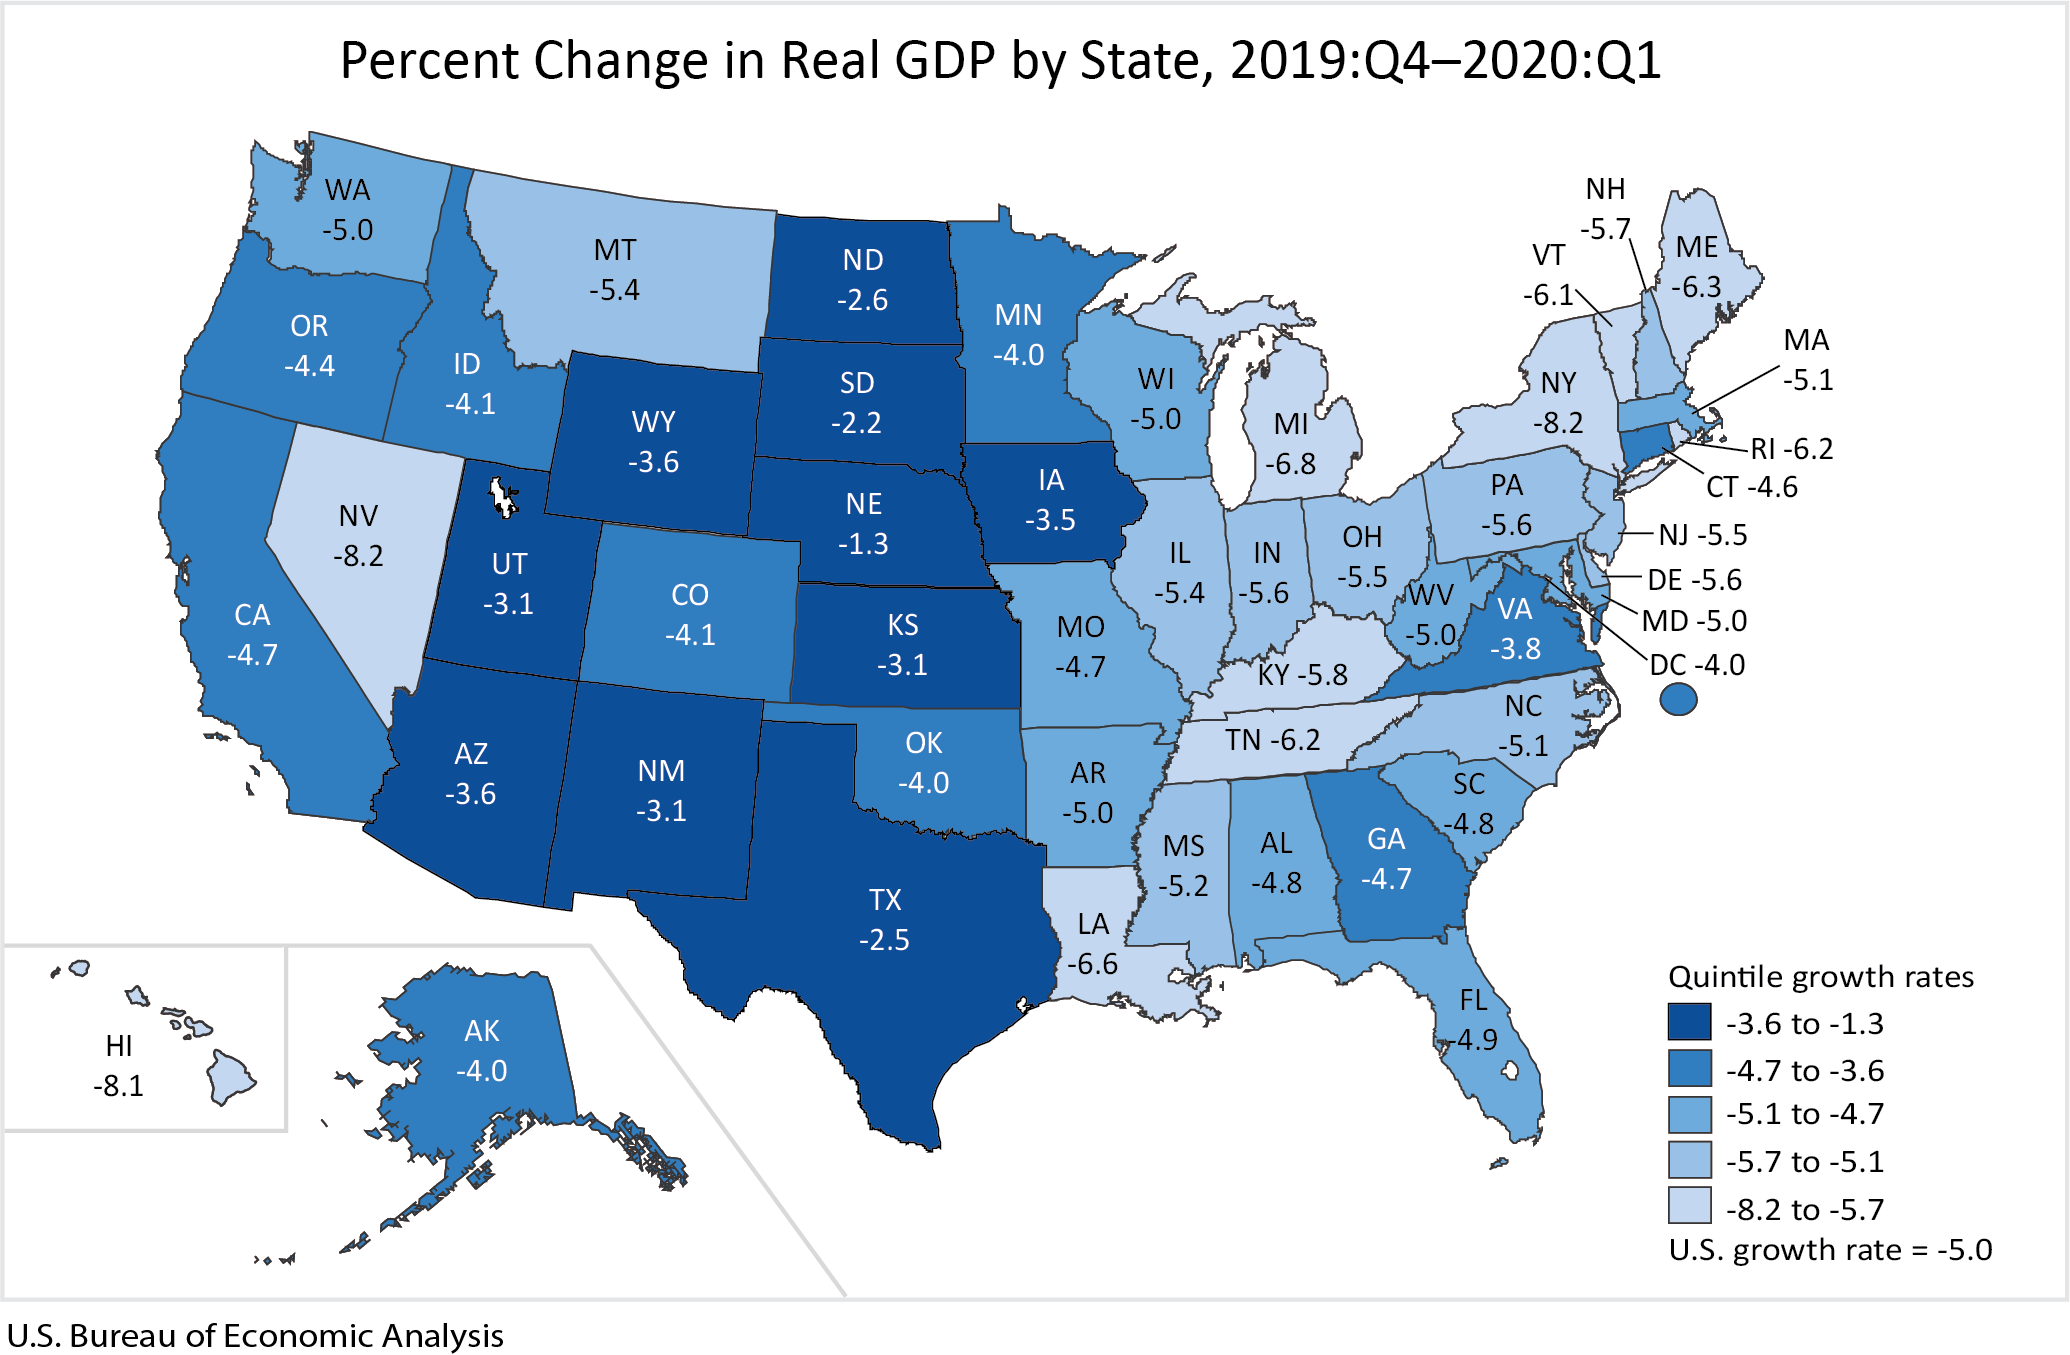
Real gross domestic product (GDP) decreased in all 50 states and the District of Columbia in the first quarter of 2020, according to statistics released today by the U.S. Bureau of Economic Analysis. The percent change in real GDP in the first quarter ranged from -1.3 percent in Nebraska to -8.2 percent in New York and Nevada.
 |
| Source: Bureau of Economic Analysis |
Link to PDF of full news release plus tables.
Saturday, July 4, 2020
Declaration of Independence: Transcription And Image
[Image of Declaration of Independence after transcription.]
From The National Archives, "Declaration of Independence: A Transcription:"
In Congress, July 4, 1776.
[Signatures Omitted]
Note: The above text is a transcription of the Stone Engraving of the parchment Declaration of Independence (the document on display in the Rotunda at the National Archives Museum.) The spelling and punctuation reflects the original.
From The National Archives, "Stone Engraving of the Declaration of Independence:"
From The National Archives, "Declaration of Independence: A Transcription:"
In Congress, July 4, 1776.
The unanimous Declaration of the thirteen united States of America, When in the Course of human events, it becomes necessary for one people to dissolve the political bands which have connected them with another, and to assume among the powers of the earth, the separate and equal station to which the Laws of Nature and of Nature's God entitle them, a decent respect to the opinions of mankind requires that they should declare the causes which impel them to the separation.
We hold these truths to be self-evident, that all men are created equal, that they are endowed by their Creator with certain unalienable Rights, that among these are Life, Liberty and the pursuit of Happiness.--That to secure these rights, Governments are instituted among Men, deriving their just powers from the consent of the governed, --That whenever any Form of Government becomes destructive of these ends, it is the Right of the People to alter or to abolish it, and to institute new Government, laying its foundation on such principles and organizing its powers in such form, as to them shall seem most likely to effect their Safety and Happiness. Prudence, indeed, will dictate that Governments long established should not be changed for light and transient causes; and accordingly all experience hath shewn, that mankind are more disposed to suffer, while evils are sufferable, than to right themselves by abolishing the forms to which they are accustomed. But when a long train of abuses and usurpations, pursuing invariably the same Object evinces a design to reduce them under absolute Despotism, it is their right, it is their duty, to throw off such Government, and to provide new Guards for their future security.--Such has been the patient sufferance of these Colonies; and such is now the necessity which constrains them to alter their former Systems of Government. The history of the present King of Great Britain is a history of repeated injuries and usurpations, all having in direct object the establishment of an absolute Tyranny over these States. To prove this, let Facts be submitted to a candid world.
He has refused his Assent to Laws, the most wholesome and necessary for the public good.
He has forbidden his Governors to pass Laws of immediate and pressing importance, unless suspended in their operation till his Assent should be obtained; and when so suspended, he has utterly neglected to attend to them.
He has refused to pass other Laws for the accommodation of large districts of people, unless those people would relinquish the right of Representation in the Legislature, a right inestimable to them and formidable to tyrants only.
He has called together legislative bodies at places unusual, uncomfortable, and distant from the depository of their public Records, for the sole purpose of fatiguing them into compliance with his measures.
He has dissolved Representative Houses repeatedly, for opposing with manly firmness his invasions on the rights of the people.
He has refused for a long time, after such dissolutions, to cause others to be elected; whereby the Legislative powers, incapable of Annihilation, have returned to the People at large for their exercise; the State remaining in the mean time exposed to all the dangers of invasion from without, and convulsions within.
He has endeavoured to prevent the population of these States; for that purpose obstructing the Laws for Naturalization of Foreigners; refusing to pass others to encourage their migrations hither, and raising the conditions of new Appropriations of Lands.
He has obstructed the Administration of Justice, by refusing his Assent to Laws for establishing Judiciary powers.
He has made Judges dependent on his Will alone, for the tenure of their offices, and the amount and payment of their salaries.
He has erected a multitude of New Offices, and sent hither swarms of Officers to harrass our people, and eat out their substance.
He has kept among us, in times of peace, Standing Armies without the Consent of our legislatures.
He has affected to render the Military independent of and superior to the Civil power.
He has combined with others to subject us to a jurisdiction foreign to our constitution, and unacknowledged by our laws; giving his Assent to their Acts of pretended Legislation:
For Quartering large bodies of armed troops among us:
For protecting them, by a mock Trial, from punishment for any Murders which they should commit on the Inhabitants of these States:
For cutting off our Trade with all parts of the world:
For imposing Taxes on us without our Consent:
For depriving us in many cases, of the benefits of Trial by Jury:
For transporting us beyond Seas to be tried for pretended offences
For abolishing the free System of English Laws in a neighbouring Province, establishing therein an Arbitrary government, and enlarging its Boundaries so as to render it at once an example and fit instrument for introducing the same absolute rule into these Colonies:
For taking away our Charters, abolishing our most valuable Laws, and altering fundamentally the Forms of our Governments:
For suspending our own Legislatures, and declaring themselves invested with power to legislate for us in all cases whatsoever.
He has abdicated Government here, by declaring us out of his Protection and waging War against us.
He has plundered our seas, ravaged our Coasts, burnt our towns, and destroyed the lives of our people.
He is at this time transporting large Armies of foreign Mercenaries to compleat the works of death, desolation and tyranny, already begun with circumstances of Cruelty & perfidy scarcely paralleled in the most barbarous ages, and totally unworthy the Head of a civilized nation.
He has constrained our fellow Citizens taken Captive on the high Seas to bear Arms against their Country, to become the executioners of their friends and Brethren, or to fall themselves by their Hands.
He has excited domestic insurrections amongst us, and has endeavoured to bring on the inhabitants of our frontiers, the merciless Indian Savages, whose known rule of warfare, is an undistinguished destruction of all ages, sexes and conditions.
In every stage of these Oppressions We have Petitioned for Redress in the most humble terms: Our repeated Petitions have been answered only by repeated injury. A Prince whose character is thus marked by every act which may define a Tyrant, is unfit to be the ruler of a free people.
Nor have We been wanting in attentions to our Brittish brethren. We have warned them from time to time of attempts by their legislature to extend an unwarrantable jurisdiction over us. We have reminded them of the circumstances of our emigration and settlement here. We have appealed to their native justice and magnanimity, and we have conjured them by the ties of our common kindred to disavow these usurpations, which, would inevitably interrupt our connections and correspondence. They too have been deaf to the voice of justice and of consanguinity. We must, therefore, acquiesce in the necessity, which denounces our Separation, and hold them, as we hold the rest of mankind, Enemies in War, in Peace Friends.
We, therefore, the Representatives of the united States of America, in General Congress, Assembled, appealing to the Supreme Judge of the world for the rectitude of our intentions, do, in the Name, and by Authority of the good People of these Colonies, solemnly publish and declare, That these United Colonies are, and of Right ought to be Free and Independent States; that they are Absolved from all Allegiance to the British Crown, and that all political connection between them and the State of Great Britain, is and ought to be totally dissolved; and that as Free and Independent States, they have full Power to levy War, conclude Peace, contract Alliances, establish Commerce, and to do all other Acts and Things which Independent States may of right do. And for the support of this Declaration, with a firm reliance on the protection of divine Providence, we mutually pledge to each other our Lives, our Fortunes and our sacred Honor.
[Signatures Omitted]
Note: The above text is a transcription of the Stone Engraving of the parchment Declaration of Independence (the document on display in the Rotunda at the National Archives Museum.) The spelling and punctuation reflects the original.
From The National Archives, "Stone Engraving of the Declaration of Independence:"
 |
| Source: The National Archives |
Friday, June 19, 2020
Men's Average Age And Education Level At Birth Of First Child
From The Wall Street Journal, "Why Some Men Delay Fatherhood: First-time fathers are now more than 27 years old, on average; lengthening transition to adulthood is one reason" by Jo Craven McGinty:
The National Center for Family and Marriage Research, where Dr. Guzzo is an affiliate, analyzed the education, relationship status and average age at fatherhood among men ages 40 to 44 using data from the National Survey of Family Growth.
A potential reason for the delay in fatherhood, the researchers found, is what demographers call the “lengthening transition to adulthood”—the point at which men (and women) feel as if they’ve achieved adult status.
 |
| Source: The Wall St Journal |
Tuesday, June 9, 2020
Where Seniors Work: Percent Of Workers 65 And Older In Selected Occupations: Chart
From The Wall Street Journal, "Older Workers Grapple With Risk of Getting Covid-19 on the Job: Coronavirus takes toll on many employees over 60 who continued to work through the pandemic" by Jacob Bunge, Alexandra Berzon and Kris Maher:
 |
| Source: Wall Street Journal |
Monday, May 18, 2020
US March-April Retail Sales By Category: Chart
From The Wall Street Journal, The Daily Shot, "The U.S. Economy to Shrink by Nearly a Third This Quarter" by Lev Borodovsky:
 |
| Source: The Wall St Journal, The Daily Shot |
Thursday, May 7, 2020
Coronavirus Outbreak In New York City Became The Primary Source Of Infections Around The United States
From The New York Times, "Travel From New York City Seeded Wave of U.S. Outbreaks: The coronavirus outbreak in New York City became the primary source of infections around the United States, researchers have found." by Benedict Carey and James Glanz:
 |
| Source: The New York Times |
New York City’s coronavirus outbreak grew so large by early March that the city became the primary source of new infections in the United States, new research reveals, as thousands of infected people traveled from the city and seeded outbreaks around the country.
Thursday, April 30, 2020
One-Third Of COVID-19 Hospitalized Patients Show Signs Of Delirium: Best Practices Not Used In The Turmoil
From ScienceBlog, "One-Third Of Hospitalized COVID-19 Patients Show Signs Of Delirium", April 27, 2020, Harvard University:
... [Harvard Professor] Sharon Inouye ... developed a [delirium] program that hundreds of hospitals have used to reduce cases of the condition by an estimated 40 percent.
... best practices for reducing delirium risk are getting lost in the turmoil of COVID-19 care.
Early data from peer-reviewed studies suggest that one-third of hospitalized COVID-19 patients of all ages, and two-thirds of those with severe disease, show signs of delirium, said Inouye. ...
... patients who experience delirium in the hospital remain hospitalized longer than their peers, have more complications and are more likely to die during their hospital stay or in the following year, need long-term care or develop cognitive impairment, including dementia.*** ... overuse of chemical restraints such as antipsychotics and other sedating drugs. ... when a patient starts to get agitated, providers get scared for the patient’s safety and their own safety and feel they have to sedate the patient. But sedating them is not always needed and leads to many complications. [Emphasis added.]
Wednesday, April 29, 2020
Decline In Healthcare Spending Caused Half The Drop In First-Quarter GDP: The Irony Of Crowded Hospitals, Overworked Doctors And Much Less Healthcare For Everyone Else
From The Wall Street Journal, Real Time Economics, "Newsletter Special Edition: The Expansion Is Over" by Jeffrey Sparshott:
Personal consumption of services was less than 30% of GDP in 1957 and 1968. Services now dominate our economy, contributing 47% of GDP last year, and they have borne the brunt of social distancing. Services consumption, from travel to restaurants to doctors’ visits, tumbled 10.2%, annualized, in the first quarter, accounting for roughly all the net decline in quarterly output. Unlike goods, services can’t be stored in inventory and are seldom imported, so almost every dollar not spent on services comes straight out of Americans’ incomes. —Greg Ip
*** Perhaps surprisingly, healthcare spending accounted for nearly half the drop in first-quarter GDP. Yes, the world is in the middle of a healthcare crisis. In all likelihood, consumers are putting off—or unable to schedule—elective and other apparently nonurgent procedures.
 |
| Source; The Wall St Journal, Real Time Economics |
Tuesday, April 28, 2020
As Many Extra Non-Covid Deaths As Covid Deaths Occurred During Height Of Epidemic: Did Hospitalization Restrictions On Treating Non-Covid Illnesses, Social Isolation, Job Losses And Business Closures Increase Deaths?
A Washington Post article (excerpted below) indicates that there were an estimated 15,400 excess deaths from March and through April 4, only half of which are attributable to Covid-19.
From The Washington Post, "U.S. deaths soared in early weeks of pandemic, far exceeding number attributed to covid-19: An analysis of federal data for the first time estimates excess deaths -- the number beyond what would normally be expected -- during that period." by Emma Brown, Andrew Ba Tran, Beth Reinhard and Monica Ulmanu:
From The Washington Post, "U.S. deaths soared in early weeks of pandemic, far exceeding number attributed to covid-19: An analysis of federal data for the first time estimates excess deaths -- the number beyond what would normally be expected -- during that period." by Emma Brown, Andrew Ba Tran, Beth Reinhard and Monica Ulmanu:
 |
| Source: Washington Post |
In the early weeks of the coronavirus epidemic, the United States recorded an estimated 15,400 excess deaths, nearly two times as many as were publicly attributed to covid-19 at the time, according to an analysis of federal data conducted for The Washington Post by a research team led by the Yale School of Public Health.
The excess deaths — the number beyond what would normally be expected for that time of year — occurred during March and through April 4, a time when 8,128 coronavirus deaths were reported.
The excess deaths are not necessarily attributable directly to covid-19, the disease caused by the coronavirus. They could include people who died because of the epidemic but not from the disease, such as those who were afraid to seek medical treatment for unrelated illnesses, as well as some number of deaths that are part of the ordinary variation in the death rate. The count is also affected by increases or decreases in other categories of deaths, such as suicides, homicides and motor vehicle accidents. [Emphasis added]
Monday, April 27, 2020
Coronavirus Data Is Missing A Baseline Mortality Rate For Those With And Without Covid-19
My posted comment to The Wall Street Journal, "Do Lockdowns Save Many Lives? In Most Places, the Data Say No: The speed with which officials shuttered the economy appears not to be a factor in Covid deaths." by TJ Rodgers:
The data is missing a baseline comparison. For a long time, the only people tested were those who has [had] symptoms similar to Covid-19, fever, etc. The number of Coronavirus cases of those tested is about 19 percent. The overall US death rate of those who tested positive is about 5.5 percent. Old people with secondary illnesses are the bulk of the 5.5 percent deaths. The symptomatic 81 percent, the negatives, did not have Covid-19. What was their death rate? Did seniors with secondary illnesses who tested negative for Covid-19 die at the same or greater rate than those who tested positive for Covid-19? We do not know. If the death rates of ill seniors with and without Covid-19 are not substantially different, why the hysteria and focus of all our attention on the Coronavirus? For example, seniors can die of pneumonia. Is there a difference if it is Covid-19 pneumonia or not a Covid-19 pneumonia? Probably only for politicians, mass media and medical reimbursement.
Wednesday, April 22, 2020
Cars And Trucks Are 40 Percent Of Oil Demand: Chart
From The Wall Street Journal, "The Daily Shot: Jet Fuel, Heating Oil at Levels Not Seen Since After 9/11" by Lev Borodovsky:
 |
| Source: The Wall St Journal, The Daily Shot |
Tuesday, April 21, 2020
Did Epidemiologists Grossly Underestimate The Public's Willingness And Ability To Reduce Daily Social Contacts?
From Gallup, Gallup Blog, April 21, 2020, "Americans' Social Contacts During the COVID-19 Pandemic" by Jonathan Rothwell:
Adults practicing social distancing generate at least 90% fewer contacts per day than those who are making little effort to social distance, according to new Gallup data. Those who completely or mostly isolate themselves generate about five contacts per day, compared with an average of 52 for those not attempting to isolate themselves.*** Yet, closing workplaces may not be the only way to mitigate contact and suppress viral transmission. Workers who visit their work site but have made changes in how they do their job reduced contacts by 29% to 69%.
Why Measuring Contacts Matters
In epidemiological models, social distancing has large effects on expected infection growth. Yet, different modeling teams have used varying assumptions for the efficacy of social distancing when it comes to reducing contacts. Getting these estimates right would thus appear crucial to accurately understanding the risks and rewards of different mitigation policies.
For example, in research published by public health scholars at Columbia University (PDF download), these scholars have assumed that social distancing can reduce at most 40% of daily contacts. An influential model from Imperial College London defined "social distancing of the entire population" as reducing workplace contacts by 25%, household contacts by 25%, and social or nonwork contacts by 75%.*** Only 3% of adults and 4% of workers have not made any attempt to isolate themselves.
Largest State Unemployment Fund Declines: Chart
From The Wall Street Journal, Real Time Economics, "Newsletter: States Burn Through Unemployment Funds" by Jeffrey Sparshott:
And nearly half of all U.S. states have logged double-digit percentage declines in their trust-fund balances since the end of February, the month before the pandemic triggered shutdowns that led to widespread job losses, Sarah Chaney reports.
States use trust funds to pay regular unemployment benefits, while the extra $600 payments recently added for workers laid off during the pandemic are funded through a federal stimulus package.
 |
| Source: The Wall St Journal, Real Time Economics |
Friday, April 17, 2020
Comparison: 2017-18 Flu Season: 61,000 US Deaths Vs Covid-19 35,500 Deaths: 65+ Seniors Were 83 Percent Of Flu Deaths (50,900, 65+ Flu Deaths)
Will the US and State governments close businesses, order wearing face masks and require social distancing during the next H3N2 Flu epidemic?
From Centers for Disease Control and Prevention (CDC), "2017-2018 Estimated Influenza Illnesses, Medical visits, Hospitalizations, and Deaths and Estimated Influenza Illnesses, Medical visits, Hospitalizations, and Deaths Averted by Vaccination in the United States":
From STAT, a December 22, 2017, article about the severity of that season's H3N2 flu strain and social gatherings spreading the flu, "Happy holidays? Flu season is raging and family gatherings may make it worse" by Helen Branswell:
From Centers for Disease Control and Prevention (CDC), "2017-2018 Estimated Influenza Illnesses, Medical visits, Hospitalizations, and Deaths and Estimated Influenza Illnesses, Medical visits, Hospitalizations, and Deaths Averted by Vaccination in the United States":
CDC estimates that the burden of illness during the 2017–2018 season was high with an estimated 45 million people getting sick with influenza, 21 million people going to a health care provider, 810,000 hospitalizations, and 61,000 deaths from influenza (Table 1). The number of cases of influenza-associated illness that occurred during 2017-2018 was the highest since the 2009 H1N1 pandemic, when an estimated 60 million people were sick with influenza.New York State, which has the bulk of US coronavirus cases, has about 51,000 cumulative hospitalizations in total compared to the past 2017-18 flu season national total of 810,000 hospitalizations.
*** ... 67% of hospitalizations occurred in older adults aged ≥65 years. Older adults also accounted for 83% of deaths, highlighting that older adults are particularly vulnerable to severe disease with influenza virus infection.
From STAT, a December 22, 2017, article about the severity of that season's H3N2 flu strain and social gatherings spreading the flu, "Happy holidays? Flu season is raging and family gatherings may make it worse" by Helen Branswell:
That means lots of people will be sick over the holidays; lots already are. And the multi-generational family gatherings that are part and parcel of the holidays will fuel the spread of the nasty virus.*** This year could well be a severe year. The viruses causing most of the illness right now are from an influenza A family called H3N2. Those viruses are especially hard on older people and H3 seasons generally are more severe that seasons when H1N1 or influenza B viruses are dominant.
Unfortunately the H3N2 component of the flu shot is an under-performer, often offering protection that is in the 30 percent range. (The other components more commonly offer between 50 percent and 70 percent protection.) So even people who have been vaccinated may find themselves coming down with flu, [Dr. Daniel] Jernigan said.
Wednesday, April 15, 2020
Private Sector Employment By Firm Size: Chart
From E21, "Covid-19 Accelerates Small Businesses’ Woes" by Allison Schrager:
 |
| Source: Manhattan Institute Via E21 |
... They [small businesses] traditionally were an engine of innovation and job creation, but in recent years they become a smaller part of the economy. They still employ many Americans but not as many as they used to.
Tuesday, April 7, 2020
Gross Domestic Product By State: 4th Quarter And Annual 2019
From US Bureau of Economic Analysis, News Release, "Gross Domestic Product by State: 4th Quarter and Annual 2019" (or PDF with tables):
***
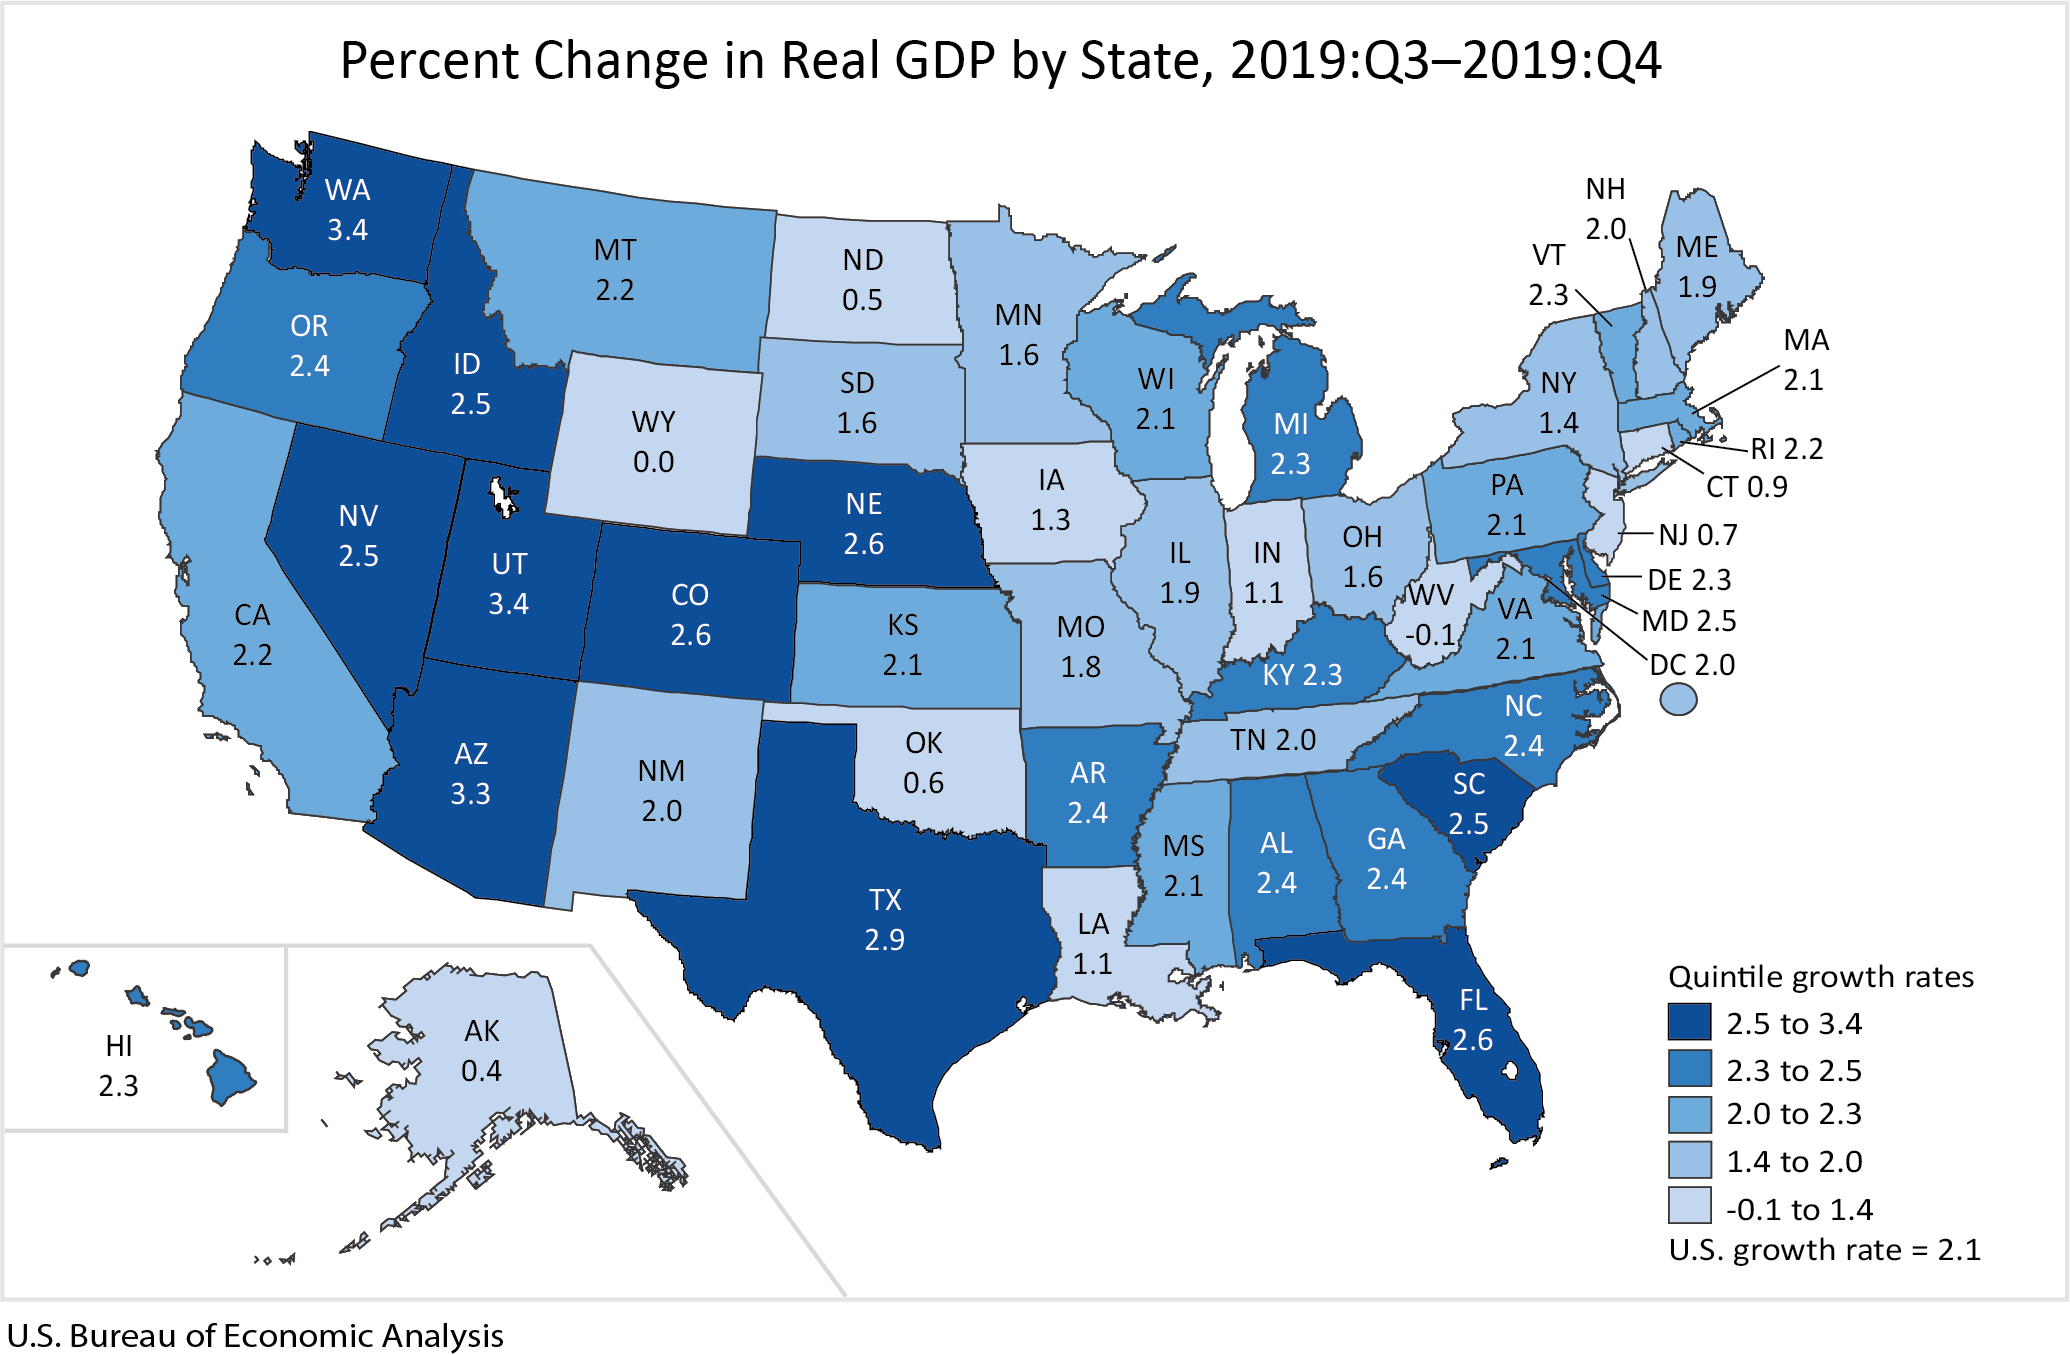
Real gross domestic product (GDP) increased in 48 states and the District of Columbia in the fourth quarter of 2019, according to statistics released today by the U.S. Bureau of Economic Analysis. The percent change in real GDP in the fourth quarter ranged from 3.4 percent in Washington and Utah to -0.1 percent in West Virginia.
 |
| Source: Bureau of Economic Analysis |
GDP by State, Annual 2019
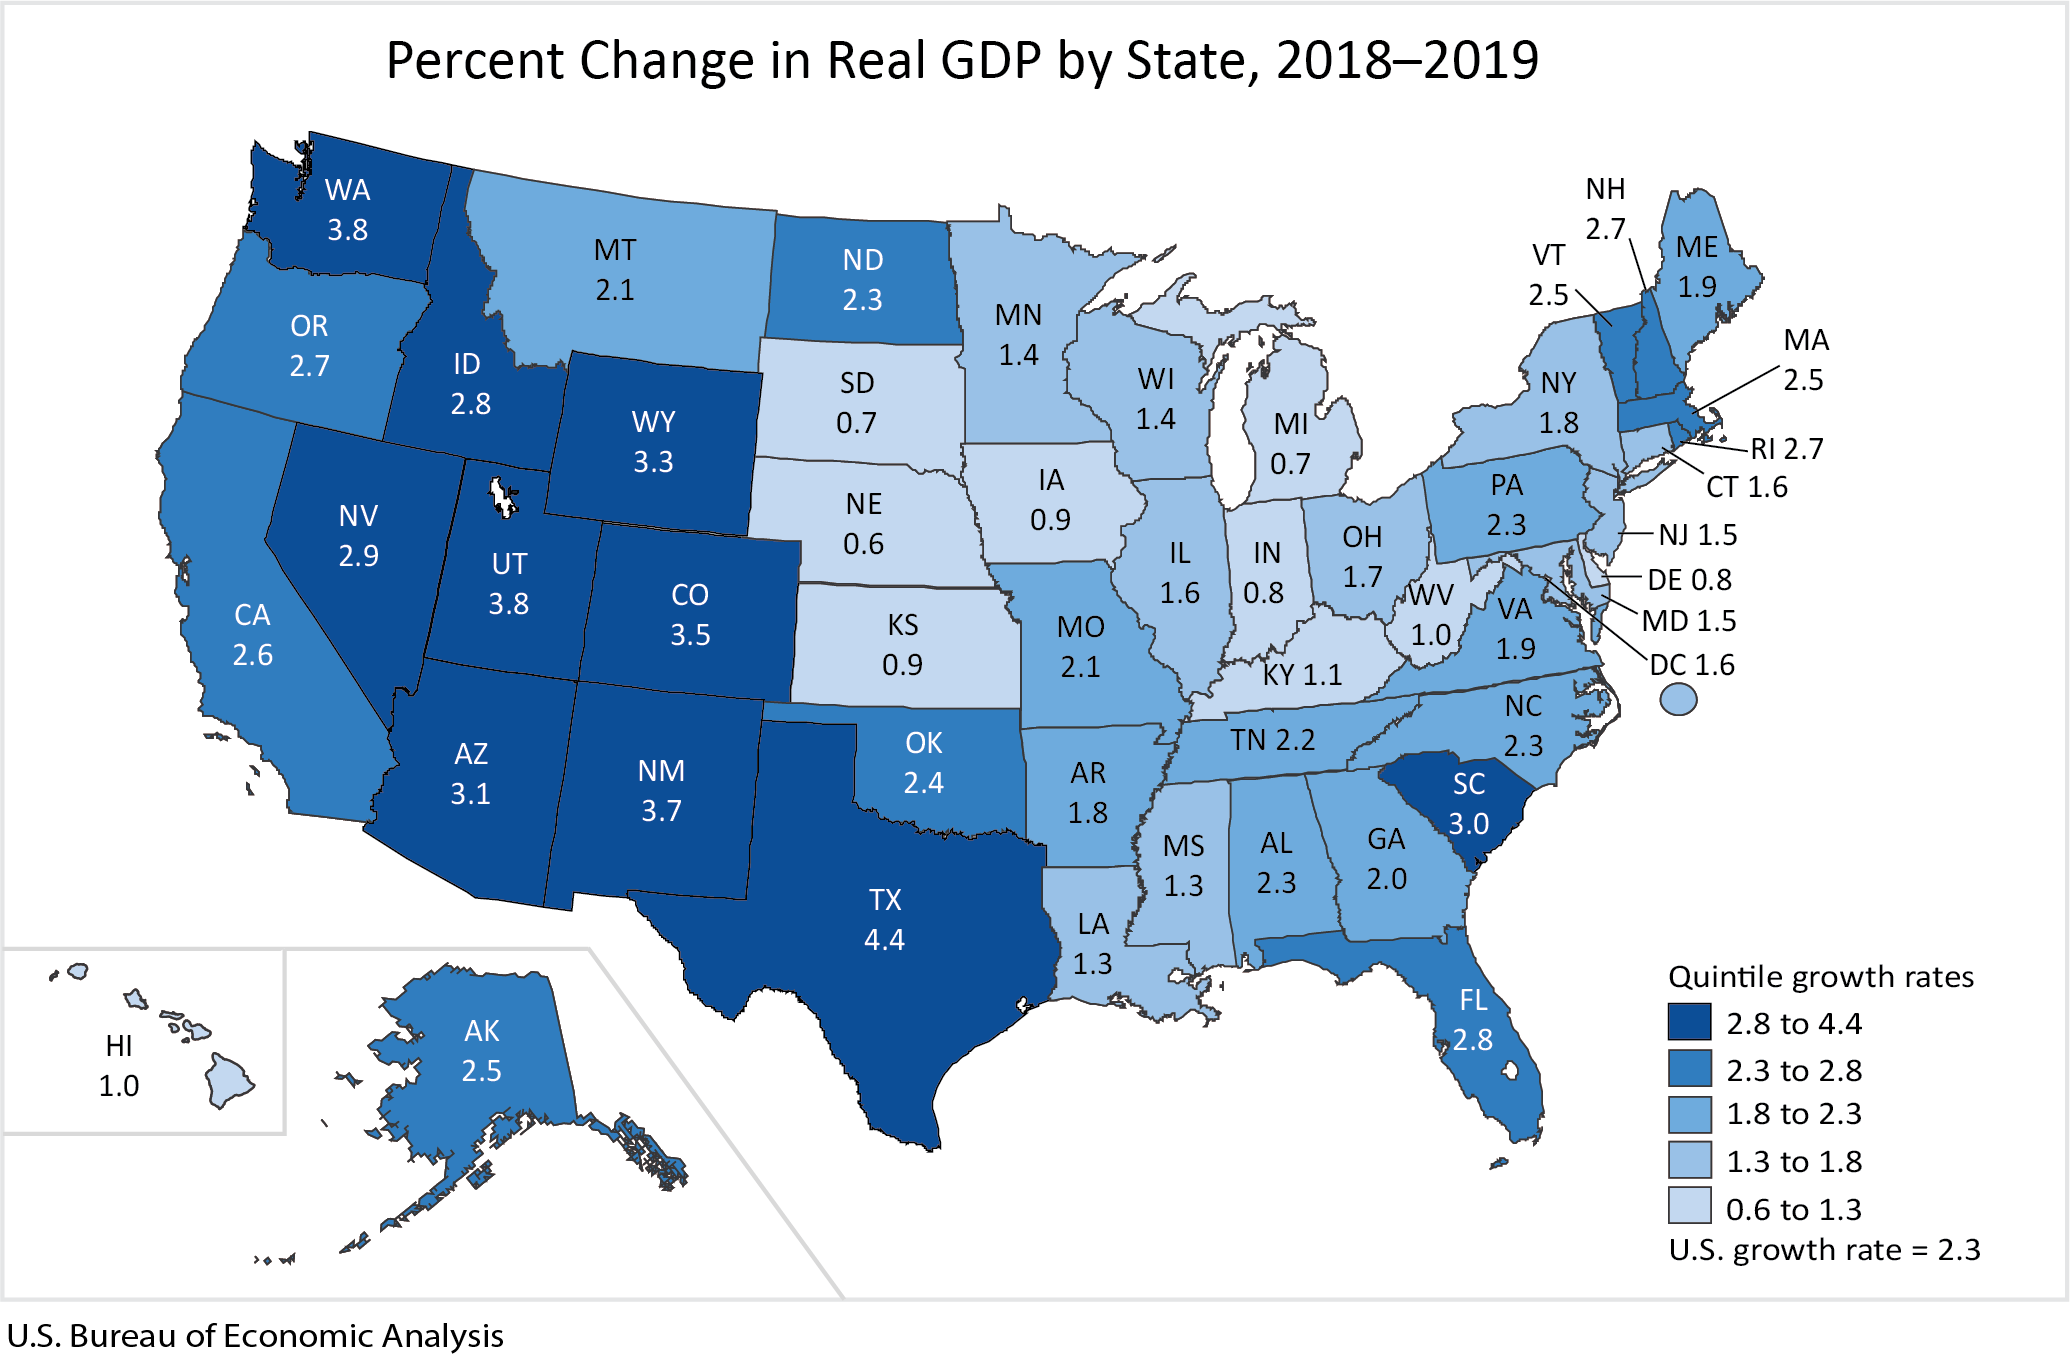
Real GDP increased in all 50 states and the District of Columbia in 2019. The percent change in real GDP ranged from 4.4 percent in Texas to 0.6 percent in Nebraska.
 |
| Source: Bureau of Economic Analysis |
Monday, April 6, 2020
NYS Coronavirus COVID-19 Deaths BY Age Group
From Daily Voice, "COVID-19: New Data On Deaths By Age Group, County Released By New York State" by Joe Lombardi:
 |
| Source: Daily Voice |
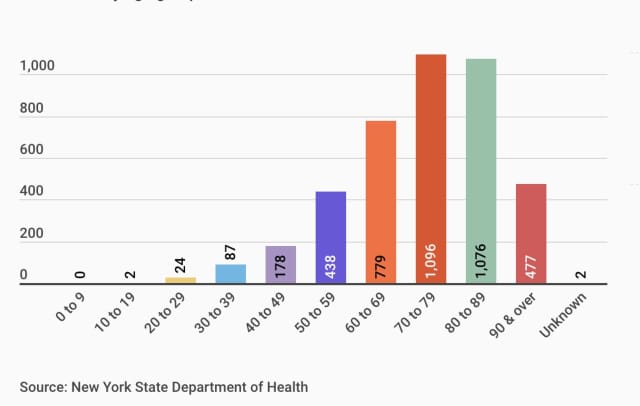
New data on the number of deaths in New York due to the novel coronavirus (COVID-19) by age group and county has been released by the state health department.
The age group with most of the state's 4,159 COVID-19 deaths is 70 to 79 with 1,096 (26.3 percent). It's followed closely by the 80-89 age group with 1,076 (25.8 percent).
Friday, March 27, 2020
CDC March 21, 2020 Update: 24,000 Influenza Deaths Including 155 Children This Season
From Centers for Disease Control and Prevention, Weekly U.S. Influenza Surveillance Report, "Key Updates for Week 12, ending March 21, 2020:"
Key Points
At the time of publishing this post, there were 100,392 Coronavirus cases and 1,543 deaths in the US. Let's hope deaths from the Coronavirus wil not reach the level of deaths from the Flu.
For the current numbers of Coronavirus cases and deaths:
https://www.worldometers.info/coronavirus/country/us/
Key Points
- Pneumonia and influenza mortality levels have been low, but 155 influenza-associated deaths in children have been reported so far this season. This number is higher than recorded at the same time in every season since reporting began in 2004-05, except for the 2009 pandemic.
- CDC estimates that so far this season there have been at least 39 million flu illnesses, 400,000 hospitalizations and 24,000 deaths from flu.
At the time of publishing this post, there were 100,392 Coronavirus cases and 1,543 deaths in the US. Let's hope deaths from the Coronavirus wil not reach the level of deaths from the Flu.
For the current numbers of Coronavirus cases and deaths:
https://www.worldometers.info/coronavirus/country/us/
Tuesday, March 24, 2020
Unanswered Coronavirus Question
The coronavirus may be a substitution of one cause of death of older, severely ill people for another cause on a death certificate. Stopping the virus might not decrease the mortality rate of the most likely affected individuals.
So far, most of the people dying from the coronavirus are older, have multiple serious health problems and more likely male. On average, an 85 year old male has almost a 10 percent one year mortality rate, a 10 percent chance of dying in one year when not adjusted for the health of the individual, A 90 year old male has a 16 percent chance of dying in one year. Individuals who have multiple serious health problems have much higher mortality rates than the above average actuarial numbers.
The important unanswered question about the coronavirus is whether or not the virus is increasing the mortality rate of severely ill older people? Whether the virus is causing excess deaths in epidemiology terms? If someone is so ill that they would have likely died from heart failure, flu, pneumonia or some other non Covid-19 cause in the next few weeks, dying from the coronavirus and listing it as the cause of death is misleading. It gives the public the false impression that but for the coronavirus the individual would have an extended life and not have died from other causes around the same time.
If stopping the virus does not increase the expected life of infected ill individuals, is it worth shutting down the economy?
Addendum
As more insurance companies modify their existing health insurance policy coverage to fully pay for coronavirus outpatient and in-hospital testing and treatment, doctors will have incentives to list more coronavirus diagnosis as the primary cause of death on medical records and death certificates in place of other causes. The number of deaths due to coronavirus will certainly be inflated by some amount and we should expect to see a sharp increase in proportional deaths around the time of expanded health care insurance coverage.
So far, most of the people dying from the coronavirus are older, have multiple serious health problems and more likely male. On average, an 85 year old male has almost a 10 percent one year mortality rate, a 10 percent chance of dying in one year when not adjusted for the health of the individual, A 90 year old male has a 16 percent chance of dying in one year. Individuals who have multiple serious health problems have much higher mortality rates than the above average actuarial numbers.
The important unanswered question about the coronavirus is whether or not the virus is increasing the mortality rate of severely ill older people? Whether the virus is causing excess deaths in epidemiology terms? If someone is so ill that they would have likely died from heart failure, flu, pneumonia or some other non Covid-19 cause in the next few weeks, dying from the coronavirus and listing it as the cause of death is misleading. It gives the public the false impression that but for the coronavirus the individual would have an extended life and not have died from other causes around the same time.
If stopping the virus does not increase the expected life of infected ill individuals, is it worth shutting down the economy?
Addendum
As more insurance companies modify their existing health insurance policy coverage to fully pay for coronavirus outpatient and in-hospital testing and treatment, doctors will have incentives to list more coronavirus diagnosis as the primary cause of death on medical records and death certificates in place of other causes. The number of deaths due to coronavirus will certainly be inflated by some amount and we should expect to see a sharp increase in proportional deaths around the time of expanded health care insurance coverage.
Wednesday, March 18, 2020
Are We Misreading COVID-19 Statistics? Where Is A Statistical Epidemiologist When You Really Need One? Total Deaths Vs Excess Deaths: Coincident Vs Causal: Contagion Rate Vs Morbidity And Mortality: Aged Adjusted Death Rate
Since death is a natural phenomenon of life, fear of death from a disease, such as the Coronavirus COVID-19, is rational and a major health concern requiring emergency measures, if the virus does the following two things:
Excess Deaths
The average US death rate from the known cases of Coronavirus is currently around 1.5 percent, (127 deaths in 8055 Coronavirus cases at the time of publishing this blog post). With many undiagnosed and recovered US Coronavirus cases still unknown, the death rate is likely very much lower than the current 1.5 percent average rate.
Looking at the Social Security Administration Actuarial Life Table for 2016, which is not adjusted for the health of individuals, males have to be 65 years old or older to have a one year mortality rate greater than the COVID-19 average mortality rate of 1.5 percent. Females have to be 70 years old or older to have a one year mortality rate greater than the COVID-19 average mortality rate of 1.5 percent. A 70 year old male has a 2.3 percent one year mortality rate.
At 85 years old, the one year mortality rate is 9.6 and 7.3 percents, respectively. By 90 years old, the one year mortality rates jump to 16 and 13 percents, respectively.
Most of the COVID-19 deaths are occurring in older people who have serious pre-existing health conditions. Their mortality rates are higher, probably much higher, due to their illness than the general population average Social Security actuarial mortality rates.
Absent more detailed contrary statistics from a Statistical Epidemiologist that includes disease mortality rates by age, illness and COVID-19 infection presence, the average Coronavirus data is not showing an excess US population death rate from the virus.
Coincidence Coincident Vs Causality
It appears that the news and our politicians are confusingcoincidence coincident with causality.
Imagine a hospital with patients in two wings, Wing A and Wing B, with each section containing severely ill patients with a 50 percent chance of dying within a month. Suppose by chance, the patients in one of the wings, Wing B, get infected with a virus. The staff diagnoses the infection and reports it to health authorities. A few weeks later, the hospital reports to authorities that half the patients in Wing B with the virus died and the others in that wing did not die or get worse.
The news headline would read, "50 percent of hospital patients with the virus died." Without a comparison to the identical, but virus free population, the 50 percent death rate is meaningless. If 50 percent of the patients in the other wing who were not infected with the virus also died, then there are no excess deaths due to the virus. The diagnoses of Wing B patients having the virus infection is a coincident factor. It it something that happened at the same time, but it is not a causal factor, a cause, of any deaths in Wing B.
Coincidence Coincident, and not causality, seems to be the state of our current COVID-19 virus data. We know the virus was present. We do not know it caused the deaths.
Premature Deaths
Looking at the SSA Actuarial Table, one can see that about 10 percent of all 85 year old males and 7 percent of all 85 year old females will die within a year. For a 90 year old, the one year death rate jumps to 16 and 13 percent.
Do we have any reliable data showing that COVID-19 infection has decreased very old senior citizen life expectancy with their already high mortality rates? Probably not.
Since many of the seniors who have died, purportedly from Coronavirus, have been seriously ill, if there were any shortening of remaining life, it may have been, if it occurred at all, for a short time of a few days or a few weeks.
Contagion Vs Morbidity VS Mortality
A high contagion rate is often mentioned about the Coronavirus COVID-19. A highly infectious disease, a high contagion rate disease, means that the disease is easily transmitted from person to person and easily spreads throughout a population. The fact that a disease is easily transmitted, does not indicate that a disease is dangerous nor does it say anything about the effect the disease will have on an individual. The virus infection could have low morbidity. The infection could be innocuous and even unnoticeable with no short or long term effects.
The fact that the Coronavirus is Contagious and has some Morbidity, symptoms, is not an indication that the disease affects Mortality rates. The common cold is highly infectious. It can cause discomfort and generally has a low mortality rate, except for those who have a very high risk for infection, such as immunosuppressed individuals or those who have certain pre-existing health conditions.
Aged Adjusted Death Rates
Comparisons are often made to other countries that are infected with the virus. The percentage numbers will be misleading unless one adjusts for the different percentages in each age group in each country. On the surface, the virus seems to affect different age segments differently. To be able to accurately compare the US to other areas of the world, the numbers for each country's infection and death rate need to be adjusted for different percentages of each population age segment in each country. The process will result in Age Adjusted Death Rates that can be used to accurately compare country death rates.
In a few years, after the studies appear, it will interesting to see if all the extra precautions put into place were warranted or an extreme over-reaction,. We will eventually find out whether the economic harm to the economy and individuals through business and government closings and self-isolation exceeded any harm that may have come form the COVID-19 Coronavirus.
- Does the virus increase the number of deaths in an age group above the normal mortality rate? In epidemiology terminology: Does the Coronavirus cause Excess Deaths?
- Does the virus cause death from various health factors to occur sooner, i.e. shorten life expectancy of an ill person? In epidemiology terminology: Does the Coronavirus cause Premature Deaths?
Excess Deaths
The average US death rate from the known cases of Coronavirus is currently around 1.5 percent, (127 deaths in 8055 Coronavirus cases at the time of publishing this blog post). With many undiagnosed and recovered US Coronavirus cases still unknown, the death rate is likely very much lower than the current 1.5 percent average rate.
Looking at the Social Security Administration Actuarial Life Table for 2016, which is not adjusted for the health of individuals, males have to be 65 years old or older to have a one year mortality rate greater than the COVID-19 average mortality rate of 1.5 percent. Females have to be 70 years old or older to have a one year mortality rate greater than the COVID-19 average mortality rate of 1.5 percent. A 70 year old male has a 2.3 percent one year mortality rate.
At 85 years old, the one year mortality rate is 9.6 and 7.3 percents, respectively. By 90 years old, the one year mortality rates jump to 16 and 13 percents, respectively.
Most of the COVID-19 deaths are occurring in older people who have serious pre-existing health conditions. Their mortality rates are higher, probably much higher, due to their illness than the general population average Social Security actuarial mortality rates.
Absent more detailed contrary statistics from a Statistical Epidemiologist that includes disease mortality rates by age, illness and COVID-19 infection presence, the average Coronavirus data is not showing an excess US population death rate from the virus.
It appears that the news and our politicians are confusing
Imagine a hospital with patients in two wings, Wing A and Wing B, with each section containing severely ill patients with a 50 percent chance of dying within a month. Suppose by chance, the patients in one of the wings, Wing B, get infected with a virus. The staff diagnoses the infection and reports it to health authorities. A few weeks later, the hospital reports to authorities that half the patients in Wing B with the virus died and the others in that wing did not die or get worse.
The news headline would read, "50 percent of hospital patients with the virus died." Without a comparison to the identical, but virus free population, the 50 percent death rate is meaningless. If 50 percent of the patients in the other wing who were not infected with the virus also died, then there are no excess deaths due to the virus. The diagnoses of Wing B patients having the virus infection is a coincident factor. It it something that happened at the same time, but it is not a causal factor, a cause, of any deaths in Wing B.
Premature Deaths
Looking at the SSA Actuarial Table, one can see that about 10 percent of all 85 year old males and 7 percent of all 85 year old females will die within a year. For a 90 year old, the one year death rate jumps to 16 and 13 percent.
Do we have any reliable data showing that COVID-19 infection has decreased very old senior citizen life expectancy with their already high mortality rates? Probably not.
Since many of the seniors who have died, purportedly from Coronavirus, have been seriously ill, if there were any shortening of remaining life, it may have been, if it occurred at all, for a short time of a few days or a few weeks.
Contagion Vs Morbidity VS Mortality
A high contagion rate is often mentioned about the Coronavirus COVID-19. A highly infectious disease, a high contagion rate disease, means that the disease is easily transmitted from person to person and easily spreads throughout a population. The fact that a disease is easily transmitted, does not indicate that a disease is dangerous nor does it say anything about the effect the disease will have on an individual. The virus infection could have low morbidity. The infection could be innocuous and even unnoticeable with no short or long term effects.
The fact that the Coronavirus is Contagious and has some Morbidity, symptoms, is not an indication that the disease affects Mortality rates. The common cold is highly infectious. It can cause discomfort and generally has a low mortality rate, except for those who have a very high risk for infection, such as immunosuppressed individuals or those who have certain pre-existing health conditions.
Aged Adjusted Death Rates
Comparisons are often made to other countries that are infected with the virus. The percentage numbers will be misleading unless one adjusts for the different percentages in each age group in each country. On the surface, the virus seems to affect different age segments differently. To be able to accurately compare the US to other areas of the world, the numbers for each country's infection and death rate need to be adjusted for different percentages of each population age segment in each country. The process will result in Age Adjusted Death Rates that can be used to accurately compare country death rates.
In a few years, after the studies appear, it will interesting to see if all the extra precautions put into place were warranted or an extreme over-reaction,. We will eventually find out whether the economic harm to the economy and individuals through business and government closings and self-isolation exceeded any harm that may have come form the COVID-19 Coronavirus.
Tuesday, February 25, 2020
Shift Government Focus From The Demand Side Of Medical Care To The Supply Of Medical Care To Lower Health Care Costs
My posted health care cost comment to John Cochrane's blog, The Grumpy Economist, "Health policy wonks and the preservation of human capital":
Shift the focus from the demand side of medical care, i.e., insurance, government subsidies (Medicare for all, Medicaid, Medicare, ACA), and price controls, to a focus on increasing the supply of medical care providers. Lower the barriers to entry for health care providers by lowering the licensing requirements and decreasing the years of education and training it takes to become an independent medical provider. Increasing the supply of medical providers until there is an oversupply will increase competition and productivity. Do the equivalent for hospitals and health facilities. Competition and productivity will remove low quality, high price inefficient providers from the marketplace and lower the costs of medical care. Lower medical care costs will lower insurance costs because insurance is just reimbursement for the cost of the use of medical care. As medical care and hospital costs decrease through productivity, insurance premiums will decline and more people will be able to afford health care. The high cost of medical care and medical insurance is a result of a limited supply of providers and low medical care productivity.
Monday, February 24, 2020
About 5% Of Americans Work More Than One Job
From E21, "Bernie’s Wrong: Americans Now Less Likely to Work 2 or 3 Jobs" by Allison Schrager:
The front-runner for the Democratic Presidential nomination, Bernie Sanders argues one reason the economy is “broken” is that "Millions of Americans are forced to work two or three jobs just to survive."
But the number of Americans working more than one job has actually been declining over the years and is only about 5%. Most multiple job holders have a full-time job and a part-time job. Only 5% of multiple job holders have two full-time jobs. Women are slightly more likely to be multiple job holders.
 |
| Source: E21 |
Wednesday, February 12, 2020
US Mortgage Foreclosures At 35-Year Low
From The Wall Street Journal, "The Daily Shot: U.S. Foreclosure Rate Drops to 35-Year Low" by Lev Borodovsky:
According to the Mortgage Bankers Association, US mortgage delinquencies as a share of total loans dropped to the lowest level in recent decades.
 |
| Source: The Wall St Journal, The Daily Shot |
And the percentage of mortgages in foreclosure is now the lowest in 35 years.
 |
| Source: The Wall St Journal, The Daily Shot |
Tuesday, February 4, 2020
Post Recession, Share Of Job Vacancies Requiring A Bachelor’s Degree Increased From 23 Percent In 2007 To 37 Percent In 2019
From "Structural Increases In Skill Demand After The Great Recession" by Peter Q. Blair and David J. Deming, NBER Working Paper 26680:
ABSTRACT In this paper we use detailed job vacancy data to estimate changes in skill demand in the years since the Great Recession. The share of job vacancies requiring a bachelor’s degree increased by more than 60 percent between 2007 and 2019, with faster growth in professional occupations and high-wage cities. Since the labor market was becoming tighter over this period, cyclical “upskilling” is unlikely to explain our findings.
PAPER Our main finding is that skill demand has increased substantially in the decade following the Great Recession. The share of online job vacancies requiring a bachelor’s degree increased from 23 percent in 2007 to 37 percent in 2019, an increase of more than 60 percent. Most of this increase occurred between 2007 and 2010, consistent with the finding that the Great Recession provided an opportunity for firms to upgrade skill requirements in response to new technologies (Hershbein and Kahn 2018).
We present several pieces of evidence suggesting that the increase in skill demand is structural, rather than cyclical. We replicate the findings of Hershbein and Kahn (2018)and Modestino, Shoag, and Ballance (2019), who show that skill demands increased morein labor markets that were harder hit by the Great Recession. However, when we extendthe sample forward and adjust for differences in the composition of online vacancies, we find that this cyclical “upskilling” fades within a few years. In its place, we find longrun structural increases in skill demand across all labor markets. In fact, we show that the increase in skill demand post-2010 is larger in higher-wage cities. We also find much larger increases in the demand for education in professional, high-wage occupations such as management, business, science and engineering.*** Our results suggest that increasing demand for educated workers is likely a persistent feature of the U.S. economy post-recession.
Thursday, January 23, 2020
Homeowners Not Selling: Lowest Inventory Level Of Existing Homes For Sale From Records Since 1982
From The Wall Street Journal, Real Time Economics | Newsletter, "Newsletter: The Number Of Homes For Sale Is At A Record Low" by Jeffrey Sparshott:
The inventory of existing homes for sale last month fell to the lowest level in records dating back to 1982, a potential stumbling block for homebuyers and catalyst for accelerating price gains. "Low inventory remains a problem, with first-time buyers affected the most,” said National Association of Realtors chief economist Lawrence Yun.
 |
| Source: The Wall St Journal, Real Time Economics |
Monday, January 13, 2020
Germany's Phase Out Of Nuclear Energy Caused Substantial Social Costs: Primarily Increased Pollution Mortality Risk: 1100 Excess Deaths Per Year
From "The Private and External Costs of Germany's Nuclear Phase-Out" by Stephen Jarvis, University of California, Berkeley - Energy and Resources Group, Olivier Deschenes, University of California, Santa Barbara - College of Letters & Science - Department of Economics; National Bureau of Economic Research (NBER); IZA Institute of Labor Economics, and Akshaya Jha, Carnegie Mellon University, NBER Working Paper No. w26598, Date Written: December 2019, Posted: 31 Dec 2019:
AbstractFrom the research paper's conclusion:
Many countries have phased out nuclear electricity production in response to concerns about nuclear waste and the risk of nuclear accidents. This paper examines the impact of the shutdown of roughly half of the nuclear production capacity in Germany after the Fukushima accident in 2011. We use hourly data on power plant operations and a novel machine learning framework to estimate how plants would have operated differently if the phase-out had not occurred. We find that the lost nuclear electricity production due to the phase-out was replaced primarily by coal-fired production and net electricity imports. The social cost of this shift from nuclear to coal is approximately 12 billion dollars per year. Over 70% of this cost comes from the increased mortality risk associated with exposure to the local air pollution emitted when burning fossil fuels. Even the largest estimates of the reduction in the costs associated with nuclear accident risk and waste disposal due to the phase-out are far smaller than 12 billion dollars.
Conclusions and Policy Discussion
Following the Fukashima disaster in 2011, German authorities made the unprecedented decision to: (1) immediately shut down almost half of the country's nuclear power plants and (2) shut down all of the remaining nuclear power plants by 2022. We quantify the full extent of the economic and environmental costs of this decision. Our analysis indicates that the phase-out of nuclear power comes with an annual cost to Germany of roughly $12 billion per year. Over 70% of this cost is due to the 1,100 excess deaths per year resulting from the local air pollution emitted by the coal-fired power plants operating in place of the shutdown nuclear plants. Our estimated costs of the nuclear phase-out far exceed the right-tail estimates of the benefits from the phase-out due to reductions in nuclear accident risk and waste disposal costs.
Friday, January 10, 2020
Based On Socioeconomic Factors, 13 Of The 15 Best Regions For African-Americans Are Located In The South: The Other Two, Maryland And DC, Border Southern States
From City Journal, "Against Tribal America: Racialism, from any side of the political spectrum, is a recipe for disaster." by Joel Kotkin:
Evaluating factors like income differentials, homeownership, business ownership, migration, and educational achievement, a study by the Center for Opportunity Urbanism (where I’m [Joel Kotkin] executive director) found that, ironically, 13 of the 15 best regions for African-Americans are today located in the old Confederacy, while the other two—Washington and Baltimore—were in border states. The worst performers were Democratic strongholds like Boston, Milwaukee, San Francisco, Minneapolis, and Los Angeles. Blue-state policies—including environmental regulations and higher taxes—also drive out blue-collar businesses that tend to hire minorities and raise housing and other costs. The biggest gap between minority and white homeownership rates—a critical component of the persistent divergence in wealth by race—can be found in left-leaning states like Rhode Island, New York, Massachusetts, and Connecticut.
Thursday, January 9, 2020
US Census Population Growth From 1790-2020 By Decade Chart: 2010-2020 Slowest Decade Population Growth Since First Census In1790
From Brookings, "The 2010s may have seen the slowest population growth in U.S. history, census data show: A 2020 census preview of population and congressional reapportionment" by William H. Frey, January 2, 2020:
The nation’s population growth from 2018 to 2019 grew by a mere 0.48%, according to newly released Census Bureau estimates. This is the lowest annual growth rate since 1918, and caps off a decade that should show the slowest 10-year population growth since the first census was taken in 1790.
 |
| Source: Brookings |
Tuesday, January 7, 2020
Average Age Of US Motor Vehicles
From Federal Reserve Bank of St. Louis, Economic Research, "The Cyclicality of the Aging U.S. Motor Vehicle Fleet" by Bill Dupor:
American car owners have been replacing their vehicles less frequently, causing the U.S. motor vehicle fleet to age (Figure 1).
***
 |
| Source: Federal Reserve Bank of St. Louis |
 |
| Source: Federal Reserve Bank of St. Louis |
Figure 2 plots an index of the number of vehicles in use (green line) and an index of per capita new-vehicle sales (blue line). [Each variable in Figure 2 is measured in per capita terms.]
Wednesday, December 18, 2019
Pre And Post SALT Deduction Tax Cap Chart Shows Wealthy Benefit The Most From SALT Deduction
From Reason, "Eat The Rich? House Democrats Plan To Pass Huge Tax Break for Wealthy Homeowners. The party that's calling for huge tax increases on the wealthy is about to hand wealthier Americans a big tax break that will add to the federal budget." by Eric Boehm:
Democrats are trying to sell the repeal of the SALT caps as a middle-class tax break, but historical evidence shows that it almost exclusively benefits high-earning homeowners who live in parts of the country where you must pay high taxes.
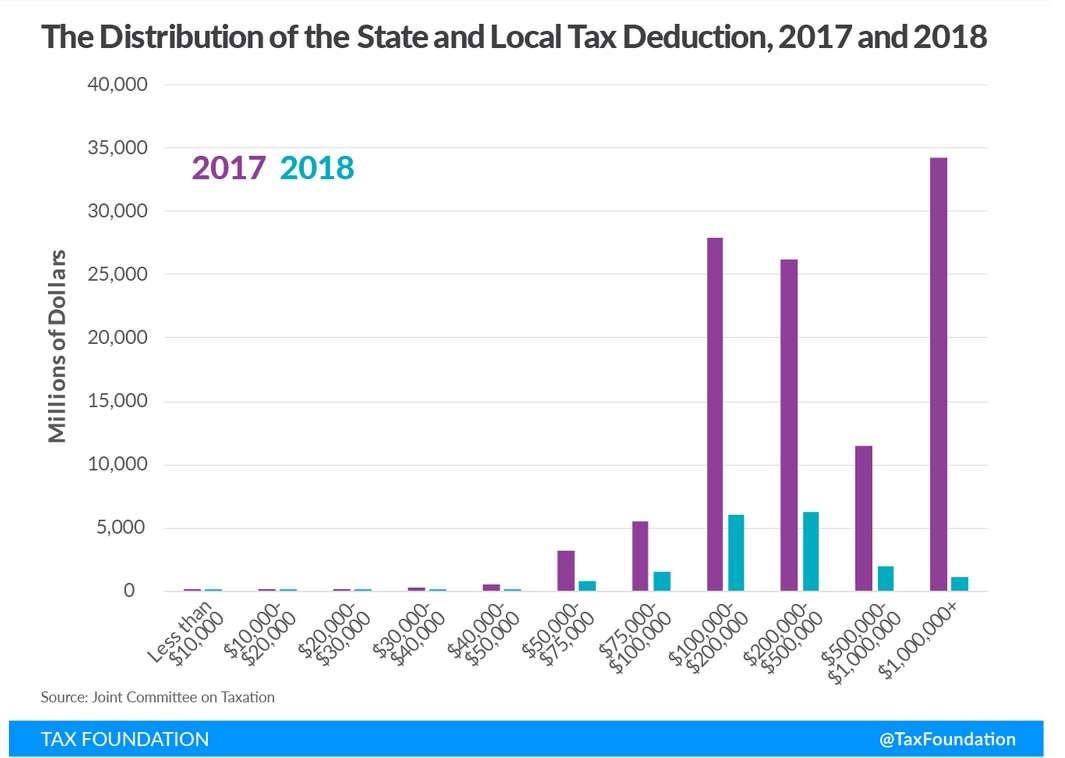 |
| Source: reason |
"Jurisdictions with higher-income residents received more of a benefit than those with lower-income residents," Nicole Kaeding, a vice president at the Tax Foundation, a nonpartisan tax policy center, explained to the House Ways and Means Committee at a hearing earlier this year. "In some ways, it allowed high-tax states and localities to export their tax liabilities to taxpayers in other states, particularly low-tax, low-income states."
Friday, December 13, 2019
It’s What You Study In College - Not Where You Study That Determines Earnings After Graduation
From E21, "For Most College Students, It’s What You Study—Not Where You Study" by Preston Cooper:
[H]ow much students earn after graduating college—where a student goes matters far less than what she chooses to study.
That is one of the principal takeaways from the updated College Scorecard, a federal dataset that reveals how much students at thousands of colleges and universities can expect to earn in their first year after graduation. Critically, the earnings data are now broken down by program of study, so prospective students can compare the earnings of, say, a history major and an engineering major who graduated from the same school. Not every program has data available, but statistics are mostly complete for the large public universities that enroll most of the nation’s undergraduates.
It is probably no surprise that majors like engineering, computer science, and nursing out-earn majors such as history, psychology, and English literature in the job market. At the University of Maryland-College Park, for instance, a history major can expect to earn just $29,000 in her first year after graduation, while a civil-engineering major at the same school has a median starting salary of nearly $65,000.
 |
| Source: E21 |
Friday, December 6, 2019
Unmeasured Illegal Activities Add Over 1 Percent To US GDP
From The Wall Street Journal, "GDP Doesn’t Include Proceeds of Crime. Should It? Sales of illegal drugs would have added $111 billion to U.S. gross domestic product, according to estimate" by Jo Craven McGinty:
***
***
When the U.S. calculates its gross domestic product, it only includes things that are legal. But if the wares of drug dealers, pimps, bookies and other black-market denizens were included, the GDP would expand by more than 1%, according to one estimate.
 |
| Source: The Wall St Journal |
... Canada has found that accounting for illicit sales of cannabis alone would add around 0.4% to its GDP. The U.K. has estimated that prostitution and illegal drugs represent around 0.4% of its GDP. And in the U.S., Rachel Soloveichik, a research economist with the Bureau of Economic Analysis, has estimated that in 2017, illegal activities would have added more than 1% to the GDP. She presented her analysis last month at the IMF Statistical Forum.
Monday, December 2, 2019
My Comment To WSJ, "How To Fix College Admission": My Answer Is, "Increase Supply"
Highly rated, highly prestigious colleges and universities deny admission to numerous undergraduate applicants who are as qualified as those that are accepted. Qualified applicants demand for admission to the top colleges exceeds the supply of available openings. In most other unregulated situations of unfilled demand, the producer of the service or product, or competitors, would increase the supply to meet the excess demand. Historical prestige and third party college rankings create a barrier that prevent newcomers and lower ranked colleges from competing for the applicants to the top tier schools. As I suggest in the following Wall Street Journal comment, prestige colleges and universities should expand geographically in the US to meet the needs of the excess demand of qualified applicants.
My published comment to The Wall Street Journal, "How to Fix College Admissions: Getting into a top school is a stressful, unpredictable process. Here are 10 ways to make it fairer and more transparent."
My published comment to The Wall Street Journal, "How to Fix College Admissions: Getting into a top school is a stressful, unpredictable process. Here are 10 ways to make it fairer and more transparent."
Increase supply to meet demand. Top ranked universities and colleges need to geographically expand their brand names. Put campuses across the US to increase enrollment. If their [sic] were multiple campuses across the US that were affiliated or under direct control of top ranked universities, then many more applicants to top schools could get degrees from top ranked schools. There are many qualified PhD's in and outside the US who cannot currently get university teaching or tenure positions. Use them to create prestigious schools across the US. Like any other product, there are winners with big market share and prestige and losers with low prestige and [low] market share. One way would be to eliminate the not for profit status of colleges and universities. A profit motive would force schools to expand their brands across the US, to expand their market share and to meet he [the] needs of a wider range of students, e.g. imagine a Harvard community college 2 year degree in every state.
Thursday, November 21, 2019
Americans Are Moving At The Lowest Rate
From The Wall Street Journal, Real Time Economics, "Newsletter: Americans Are Moving at the Lowest Rate on Record" by Jeffrey Sparshott:***
Americans are moving at the lowest rate on record. New Census Bureau data show 9.8% of the U.S. population age 1 and older changed addresses over the past year, the smallest share in records dating back to 1948. The latest figures highlight a long-term decline in American mobility—through much of the 1950s and 1960s around 20% of the population moved to a new home each year.
 |
| Source: The Wall St Journal, Real Time Economics |
Subscribe to:
Posts (Atom)