Wednesday, September 18, 2013

An Analysis Of Each State's Unfunded Pension Liability

An analysis by State Budget Solutions, a 501(c)(3) non-profit, finds that State pension plans are on average only 39 percent funded. The included table below shows each State's pension numbers.

From State Budget Solutions, "Promises Made, Promises Broken - The Betrayal of Pensioners and Taxpayers" by Cory Eucalitto:
Comprehensive research into the funded status of state level defined benefit public pension plans reveals that public employee retirement promises are underfunded by $4.1 trillion. Combined, state public pension plans are just 39 percent funded.

Figures were drawn from state Fiscal Year 2012 Comprehensive Annual Financial Reports, as well as the Comprehensive Annual Financial Reports and actuarial valuations published by individual plans. In each case, figures were from the most up-to-date valuation available at the time of research. Plans were compiled based on the United States Census Bureau's Annual Survey of Public Pensions and state-level financial reports. Therefore this includes municipal pension funds that are administered by the state.
***

StateActuarial AssetsMarket LiabilityFunded RatioUnfunded Liability
Alabama$28,136,859$83,416,28934%$55,279,430
Alaska$10,257,331$33,972,93130%$23,715,600
Arizona$30,716,205$81,099,67238%$50,383,467
Arkansas$19,914,988$55,016,30736%$35,101,319
California$459,450,490$1,100,068,95042%$640,618,460
Colorado$40,915,702$124,738,61633%$83,822,914
Connecticut$25,492,957$102,247,87425%$76,754,917
Delaware$7,862,654$16,287,44648%$8,424,792
Florida$127,891,781$280,543,39246%$152,651,611
Georgia$69,392,153$154,949,79945%$85,557,646
Hawaii$12,242,500$39,193,56331%$26,951,063
Idaho$11,657,299$25,241,56146%$13,584,262
Illinois$91,521,686$378,567,67924%$287,045,993
Indiana$25,156,363$68,175,59637%$43,019,233
Iowa$25,778,883$59,705,14443%$33,926,261
Kansas$13,278,490$46,167,69129%$32,889,201
Kentucky$26,060,181$97,225,99927%$71,165,818
Louisiana$33,578,010$108,503,08931%$74,925,079
Maine$11,076,400$24,761,72445%$13,685,324
Maryland$37,448,661$110,513,04834%$73,064,387
Massachusetts$43,493,039$132,310,59333%$88,817,554
Michigan$59,934,079$178,436,10534%$118,502,026
Minnesota$47,954,571$127,349,65538%$79,395,084
Mississippi$20,429,973$69,238,31630%$48,808,343
Missouri$48,699,412$121,416,55740%$72,717,145
Montana$7,631,673$22,633,20534%$15,001,532
Nebraska$9,058,379$22,439,82340%$13,381,444
Nevada$27,466,740$75,934,90536%$48,468,165
New Hampshire$5,861,896$19,751,86730%$13,889,971
New Jersey$85,938,988$257,614,70233%$171,675,714
New Mexico$21,397,284$64,212,78133%$42,815,497
New York$230,680,400$490,756,06247%$260,075,662
North Carolina$78,403,200$145,436,34054%$67,033,140
North Dakota$3,498,700$10,806,86232%$7,308,162
Ohio$146,123,868$433,497,66834%$287,373,800
Oklahoma$21,469,876$62,963,72434%$41,493,848
Oregon$44,943,100$120,068,76337%$75,125,663
Pennsylvania$85,323,119$241,959,10035%$156,635,981
Rhode Island$7,533,391$22,540,48133%$15,007,090
South Carolina$29,555,334$82,721,84136%$53,166,507
South Dakota$7,935,490$15,141,57252%$7,206,082
Tennessee$36,680,783$73,328,48350%$36,647,700
Texas$183,833,884$427,998,12343%$244,164,239
Utah$21,369,935$51,129,68742%$29,759,752
Vermont$3,335,632$8,853,16238%$5,517,530
Virginia$54,473,000$133,823,92141%$79,350,921
Washington$60,829,300$124,883,77749%$64,054,477
West Virginia$10,220,671$29,152,50535%$18,931,834
Wisconsin$78,940,000$138,707,03957%$59,767,039
Wyoming$6,609,063$16,284,76741%$9,675,704
Total$2,597,454,373$6,711,788,75839%$4,114,334,385

[HT: Newmark's Door]

Tuesday, September 17, 2013

Asians Have Highest Household Median Income: All Household Groups Below Pre-2001 Level

From The Wall Street Journal, Real Time Economics, "Asian Households Have Highest Income, Blacks the Lowest"
Among the race groups, Asian households had the highest median income in 2012 ($68,636). The median income for non-Hispanic White households was $57,009, and it was $33,321 for Black households. For Hispanic households the median income was $39,005. The real median incomes in 2012 of non-Hispanic White households, Black households, Asian households, and Hispanic-origin households were not statistically different from their respective 2011 medians.

median household income
Source: The Wall Street Journal

The real median household income for each of the race and Hispanic-origin groups have not yet recovered to their pre-2001 recession median household income peaks. Household income in 2012 was 6.3 percent lower for non-Hispanic Whites (from $60,849 in 1999), 15.8 percent lower for Blacks (from $39,556 in 2000), 7.7 percent lower for Asians (from $74,343 in 2000), and 11.8 percent lower for Hispanics (from $44,224 in 2000).

CBO 2013 Long-Term Budget Outlook: Full Report: US Debt To Exceed 100 Percent Of GDP

The complete CBO budget outlook report is embedded at the end of this post.

From CBO, "The 2013 Long-Term Budget Outlook:"
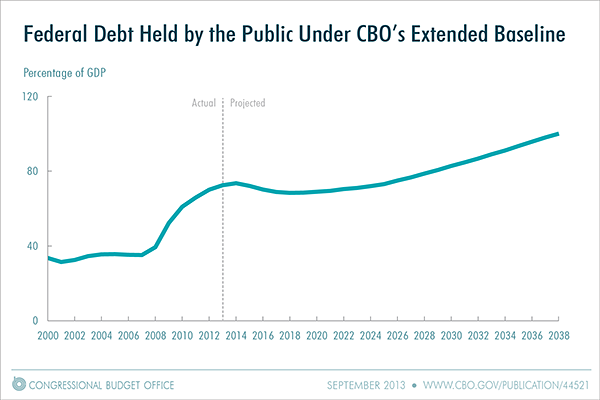
Between 2009 and 2012, the federal government recorded the largest budget deficits relative to the size of the economy since 1946, causing federal debt to soar. Federal debt held by the public is now about 73 percent of the economy’s annual output, or gross domestic product (GDP). That percentage is higher than at any point in U.S. history except a brief period around World War II, and it is twice the percentage at the end of 2007. If current laws generally remained in place, federal debt held by the public would decline slightly relative to GDP over the next several years, CBO projects. After that, however, growing deficits would ultimately push debt back above its current high level. CBO projects that federal debt held by the public would reach 100 percent of GDP in 2038, 25 years from now, even without accounting for the harmful effects that growing debt would have on the economy (see the figure below). Moreover, debt would be on an upward path relative to the size of the economy, a trend that could not be sustained indefinitely.
CBO Long-Term Budget Outlook
Source: CBO

The complete CBO 176-page report follows:

EPA Estimates Significantly Overstate Greenhouse Gas Emissions From Natural Gas Wells

From The Wall Street Journal, "U.S. Overstates Leaks by Gas-Drillers, Says Study: University of Texas Researchers Challenge Methane Emissions by Fracking" by Russell Gold:
Natural-gas drilling sites aren't leaking as much methane into the atmosphere as the federal government and critics of hydraulic fracturing had believed, according to the first study of emissions at multiple drilling sites.

The study, led by researchers at the University of Texas at Austin and published on Monday by the Proceedings of the National Academy of Sciences, is likely to ease some concerns about the impact of natural-gas extraction on the climate.

Measuring emissions at 190 sites, the study found less "fugitive methane" than previous work by the Environmental Protection Agency and some university researchers, which relied on estimates. Methane, the primary ingredient in natural gas, is a potent greenhouse gas.
***
But the measurements of gas emissions found that wells emitted about 20% less greenhouse gases than the EPA had estimated—which is less than the amount emitted by burning coal.
As a mathematical note, a 20 percent decrease is equivalent to a 25 percent increase. Starting from the estimate, the reality is 20 percent less (using 100 as an example of the estimate, 80 is 20 percent less than 100). Starting from the reality, the estimate is 25 percent more (100 is 25 percent more than 80). The EPA has overstimated the greenhouse gas emissions from natural gas wells by 25 percent.

From a global warming perspective, the heat trapping impact of methane gas is 20 times that of carbon dioxide (CO2). The EPA's overestimation of the amount of methane gas released is equivalent to saying that 5 times or 500 percent more carbon dioxide was released than actually occurred. (20 times 25 percent is 500 percent which also equals 5).

Monday, September 16, 2013

36 Percent Of Government Workers Compared To 6.6 Percent Of Private Sector Workers Belong To A Labor Union

From The Wall Street Journal, Opinion, "Members Not Only: I joined the AFL-CIO and all I got was this lousy T-shirt:"
Union Membership Share Of Government And Private Sector Workers
Source: The Wall Street Journal
***
Union share of government workers has remained more stable, though that is also helped by government rules that require dues payments once a worksite is organized.

When government workers are given the choice of membership, as in Indiana and Wisconsin in recent years, they drop out in droves. Last week the teachers union in Kenosha, Wisconsin became the latest to be decertified after it lost its bargaining monopoly under Governor Scott Walker's 2011 reform.

Friday, September 13, 2013

Lost Career Paths And Economic Plight Of Young Adults

From The Wall Street Journal, "Wanted: Jobs for the New 'Lost' Generation: Five years after the 2008 crisis, younger adults still struggle to find work" by Ben Casselman And Marcus Walker:
But the recovery has left many young people behind. The official unemployment rate for Americans under age 25 was 15.6% in August, down from a peak of nearly 20% in 2010 but still more than 2½ times the rate for those 25 and older—a gap that has widened during the recovery. Moreover, the unemployment rate ignores the hundreds of thousands of young people who have taken shelter from the weak job market by going to college, enrolling in training programs or otherwise sitting on the sidelines. Add them back in, and the unemployment rate for Americans under 25 would be over 20%.

Even those lucky enough to be employed are often struggling. Little more than half are working full time—compared with about 80% of the population at large—and 12% earn minimum wage or less. The median weekly wage for young workers has fallen more than 5% since 2007, after adjusting for inflation; for those 25 and older, wages have stayed roughly flat.
***
Economic research has shown that the first few years after college play an outsize role in determining workers' career trajectories: About two-thirds of wage growth, on average, comes in the first 10 years of a person's career. In weak economic times, graduates are likely to accept lower wages and work for smaller companies with fewer opportunities for advancement. And in many cases, they never move off that second-tier track. [Emphasis added.]

First Example Of A Working Cog Wheel Mechanism In A Living Organism Found

From Phys Org, "Functioning 'mechanical gears' seen in nature for the first time:"

This image shows cog wheels connecting the hind legs of the plant hopper, Issus. Credit: Burrows/Sutton
This image shows cog wheels connecting the hind legs of the plant hopper, Issus.
Credit: Burrows/Sutton. Source: Phys Org.
a plant-hopping insect found in gardens across Europe - has hind-leg joints with curved cog-like strips of opposing 'teeth' that intermesh, rotating like mechanical gears to synchronise the animal's legs when it launches into a jump.

The finding demonstrates that gear mechanisms previously thought to be solely man-made have an evolutionary precedent. Scientists say this is the "first observation of mechanical gearing in a biological structure".

The Material Well-Being Of The Poor In The US Is High

From The Circle Bastiat Blog, "Poverty Just Ain’t What It Used To Be" by Joseph Salerno:
A newly released report by the U.S. Census Bureau indicates that most Americans living below the bureaucratically designated “poverty line” enjoy most modern conveniences. For example more than 80 percent of U.S. households below the poverty line have a: refrigerator (97.8%); stove (96.6%); television (96.1%); microwave oven (93.1%); air conditioner (83.4%); VCR/DVD player (83.2%); and cell phone (80.9%). In addition, more than half of households beneath the poverty level also have a: clothes washer (68.7%); clothes dryer (65.3%); computer (58.2%); and landline telephone (54.9).
***
But this comparison obscures the important point that capitalism long ago solved the problem of poverty in a meaningful sense and in doing so radically transformed the very concept of poverty.

Wednesday, September 11, 2013

Comment About Top 1 And 10 Percent Income Gains Posted On NYTimes And Wall St Journal

The comment I posted about the rich getting richer on The New York Times and The Wall St Journal in response to their respective articles on the subject:
The new data is consistent with an economy of higher than normal unemployment, high number of part-time workers, low workforce participation, and low unemployment among the college educated. Saez ignores and excludes government benefits as income, but his results are also consistent with the expansion of government benefits, such as the large number of people on SNAP (Food Stamps), extended unemployment insurance, and other income based programs (for example insurance subsidies under ACA) which are disincentives to working harder and earning more.

Saez in his paper says, “The evidence suggests that top incomes earners today are not ‘rentiers’ deriving their incomes from past wealth but rather are ‘working rich,’ highly paid employees or new entrepreneurs….”

Saez also fails to adjust for international versus domestic components of US management and entrepreneur labor. Years ago, US companies only had US employees and plants. Today, many of the larger US companies have US management employees who are overseeing worldwide manufacturing and sales. You pay one salary for a company CEO that only sells in the US and you pay a much higher salary for a CEO whose company sells worldwide. The business world is getting more global. The employees responsible for managing and attaining worldwide growth are increasing and are paid more than the employees who job is strictly domestic. [NYTimes 1500 character limit ended comment here. Next few sentences appear on Wall St Journal only.] A domestic plumber is paid a decent salary. A CEO of a US plumbing company with worldwide business will be paid more than a plumber and more than a CEO of a plumbing company with only US domestic sales. Increasing globalization is increasing the income returns to the more educated and driving some of the upper income gains.

Private Sector Employee Benefits Average 29.7 Percent Of Compensation Cost: Public Sector Employee Benefits Average 35.5 Percent Of Compensation Cost

From Bureau of Labor Statistics, Economic News Release, "Employer Costs For Employee Compensation – June 2013:"
Private industry employers spent an average of $29.11 per hour worked for employee compensation in June 2013, the U.S. Bureau of Labor Statistics reported today. Wages and salaries averaged $20.47 per hour worked and accounted for 70.3 percent of these costs, while benefits averaged $8.64 and accounted for the remaining 29.7 percent. Total compensation costs for state and local government workers averaged $42.09 per hour worked in June 2013. Total compensation costs for civilian workers, which include private industry and state and local government workers, averaged $31.00 per hour worked in June 2013.
***

Table A. Relative importance of employer costs for employee compensation, June 2013
Compensation                   Civilian    Private   State, local
component                      workers     industry   government
_________________________________________________________________
Wages and salaries               69.2%       70.3%         64.5%
Benefits                         30.8        29.7          35.5
   Paid leave                     7.0         6.9           7.4
   Supplemental pay               2.4         2.8           0.8
   Insurance                      9.0         8.2          12.2
     Health benefits              8.5         7.7          11.8
   Retirement and savings         4.7         3.7           9.0
     Defined benefit              2.9         1.6           8.3
     Defined contribution         1.8         2.1           0.8
   Legally required               7.8         8.2           6.1
__________________________________________________________________

The Financial Crisis Five Years Later: US Treasury Department: September 2013

The Financial Crisis Five Years Later: RESPONSE, REFORM, AND PROGRESS: US Treasury Department: September 2013:

Tuesday, September 10, 2013

Teaching Coping, Social Functioning And Problem Solving Skills To High School Students Improves Grades, Social Skills And Depression

Adding an in-school cognitive-behavioral intervention program that teaches coping techniques, social functioning skills, and problem solving skills, improves high school students health behaviors, social skills, severe depression, and academic performance.

From the National Institute of Health, "Lifestyle intervention improves high schoolers’ health, social skills, grades:"
A teacher-delivered intervention program promoting healthy lifestyles improved health behaviors, social skills, severe depression, and academic performance in high school adolescents, a study has found. Routine integration of such programs into health education curricula in high school settings may be an effective way to prevent high-risk teen populations from becoming overweight or obese, and could lead to improved physical health, psychosocial skills, and academic outcomes, according to the study.

The study, supported by the National Institute of Nursing Research (NINR), part of the National Institutes of Health, appears in the online September issue of the American Journal of Preventive Medicine. It is one of the first studies to report multiple immediate improvements that were sustained over time using a teacher-delivered, cognitive-behavioral skills-building intervention program incorporated into a high school health education class. Cognitive-behavioral skills training teaches coping techniques, social functioning skills, and problem solving skills.

Saturday, September 7, 2013

Rooftop Solar Panels Hinder Firefighting And Endanger Firefighters

From Yahoo News, "Rooftop solar panels become new enemy of U.S. firefighters" by By Daniel Kelley, Reuters:
...solar panels pose a growing threat to firefighters, who may suffer electrical shocks from panels that typically cannot be turned off, said John Drengenberg, consumer safety director for Underwriters Laboratories.

Even when systems are equipped with shutoffs, any light can keep panels and their wires energized, Drengenberg said.

Gaining access to roofs gives firefighters advantages such as venting gases, and the panels get in the way, said Ken Willette, who manages the public fire protection division at the National Fire Protection Association.

Thursday, September 5, 2013

Half Of The US Population Lives In Less Than 5 Percent Of US Counties

From Business Insider, "Half Of The United States Lives In These Counties" by Walter Hickey and Joe Weisenthal:
Using Census data, we've figured out that half of the United States population is clustered in just the 146 biggest counties out of over 3000.

Here's the map, with said counties shaded in. [The original website has a list of the 146 counties shaded as blue.]

Source: Business Insider


Wednesday, September 4, 2013

2003 And 2009 Videos Of Addresses By Ronald Coase On Markets, Firms And Property Rights

In memory of Ronald Coase, 1910-2013.

University of Chicago statement about Ronald Coase.

I have embedded two relatively recent video lectures by Ronald Coase below:

Centennial (17th Annual) Coase Lecture:

The 17th annual Coase Lecture, presented by Ronald Coase on April 1, 2003 (56 minutes):


Markets, Firms and Property Rights Conference

From The University of Chicago, "Ronald Coase: 'Markets, Firms and Property Rights' " recorded November 23, 2009 (25 minutes):
This address by Ronald Coase (Clifton R. Musser Professor Emeritus of Economics at the University of Chicago Law School) to the conference "Markets, Firms and Property Rights: A Celebration of the Research of Ronald Coase" was recorded November 23, 2009.