Correcting misconceptions about markets, economics, asset prices, derivatives, equities, debt and finance
Monday, November 11, 2024
Timely Blog Repost: Common Myths Of Capitalism: Jeff Miron: Video
Posted By Milton Recht
Originally posted on Wednesday, August 24, 2011.
Monday, September 9, 2024
Friday, August 16, 2024
Monday, July 29, 2024
High Tax Rates Benefit Liberal Democrats More Than Republicans When Tax Deductions Are Not Limited
Posted By Milton Recht
Reprint below of an excerpt of my 2012 blog post, "Raising Federal Income Tax Rates Without Limiting Tax Deductions Benefits Liberal Democrats More Than Republicans:"
Posted By Milton Recht***
Monday, December 17, 2012
Raising Federal Income Tax Rates Without Limiting Tax Deductions Benefits Liberal Democrats More Than Republicans
Posted By Milton Recht
Posted by Milton Recht:
Liberal Democrats tend to live in the higher tax states and they take bigger federal income tax deductions for state and local taxes. Raising federal tax rates makes the deduction for state and local taxes more valuable. The higher federal tax rates lowers the burden of high state taxes to high income earners, while raising the federal tax burden of low state tax residents.
The increase loss of federal income tax revenues from the deductions under higher income tax rates is borne by residents in low tax states, mostly Republicans, who take smaller deductions for state and local taxes. The net effect is that low tax state residents will pay a bigger part of the high tax state government employee salaries, benefits and pensions.
By not limiting deductions, while raising federal tax rates, Obama will unfairly increase the federal tax burden of low tax state residents for the higher spending of high tax states.
Raising the tax rates on the rich is not fair unless income tax deductions for state and local taxes are also limited.
Wednesday, July 17, 2024
Understanding Productivity Growth: CBO’s Economic Forecast
Posted By Milton Recht
From "CBO’s Economic Forecast: Understanding Productivity Growth," July 16, 2024, Presentation by Aaron Betz, an analyst in CBO’s Macroeconomic Analysis Division, at the NABE Foundation's 21st Annual Economic Measurement Seminar:
CBO regularly publishes economic projections that are consistent with current law—providing a basis for its estimates of federal revenues, outlays, deficits, and debt. A key element in CBO’s projections is its forecast of potential (maximum sustainable) output, which is based mainly on estimates of the potential labor force, the flow of services from the capital stock, and potential total factor productivity in the nonfarm business sector. This presentation describes CBO’s most recent 10-year projections of potential output, highlighting the importance of potential total factor productivity. It discusses the historic slowdown of growth in total factor productivity, as well as changes in total factor productivity during the coronavirus pandemic, and it explores possible explanations for the slowdown and implications for the future.
Monday, July 1, 2024
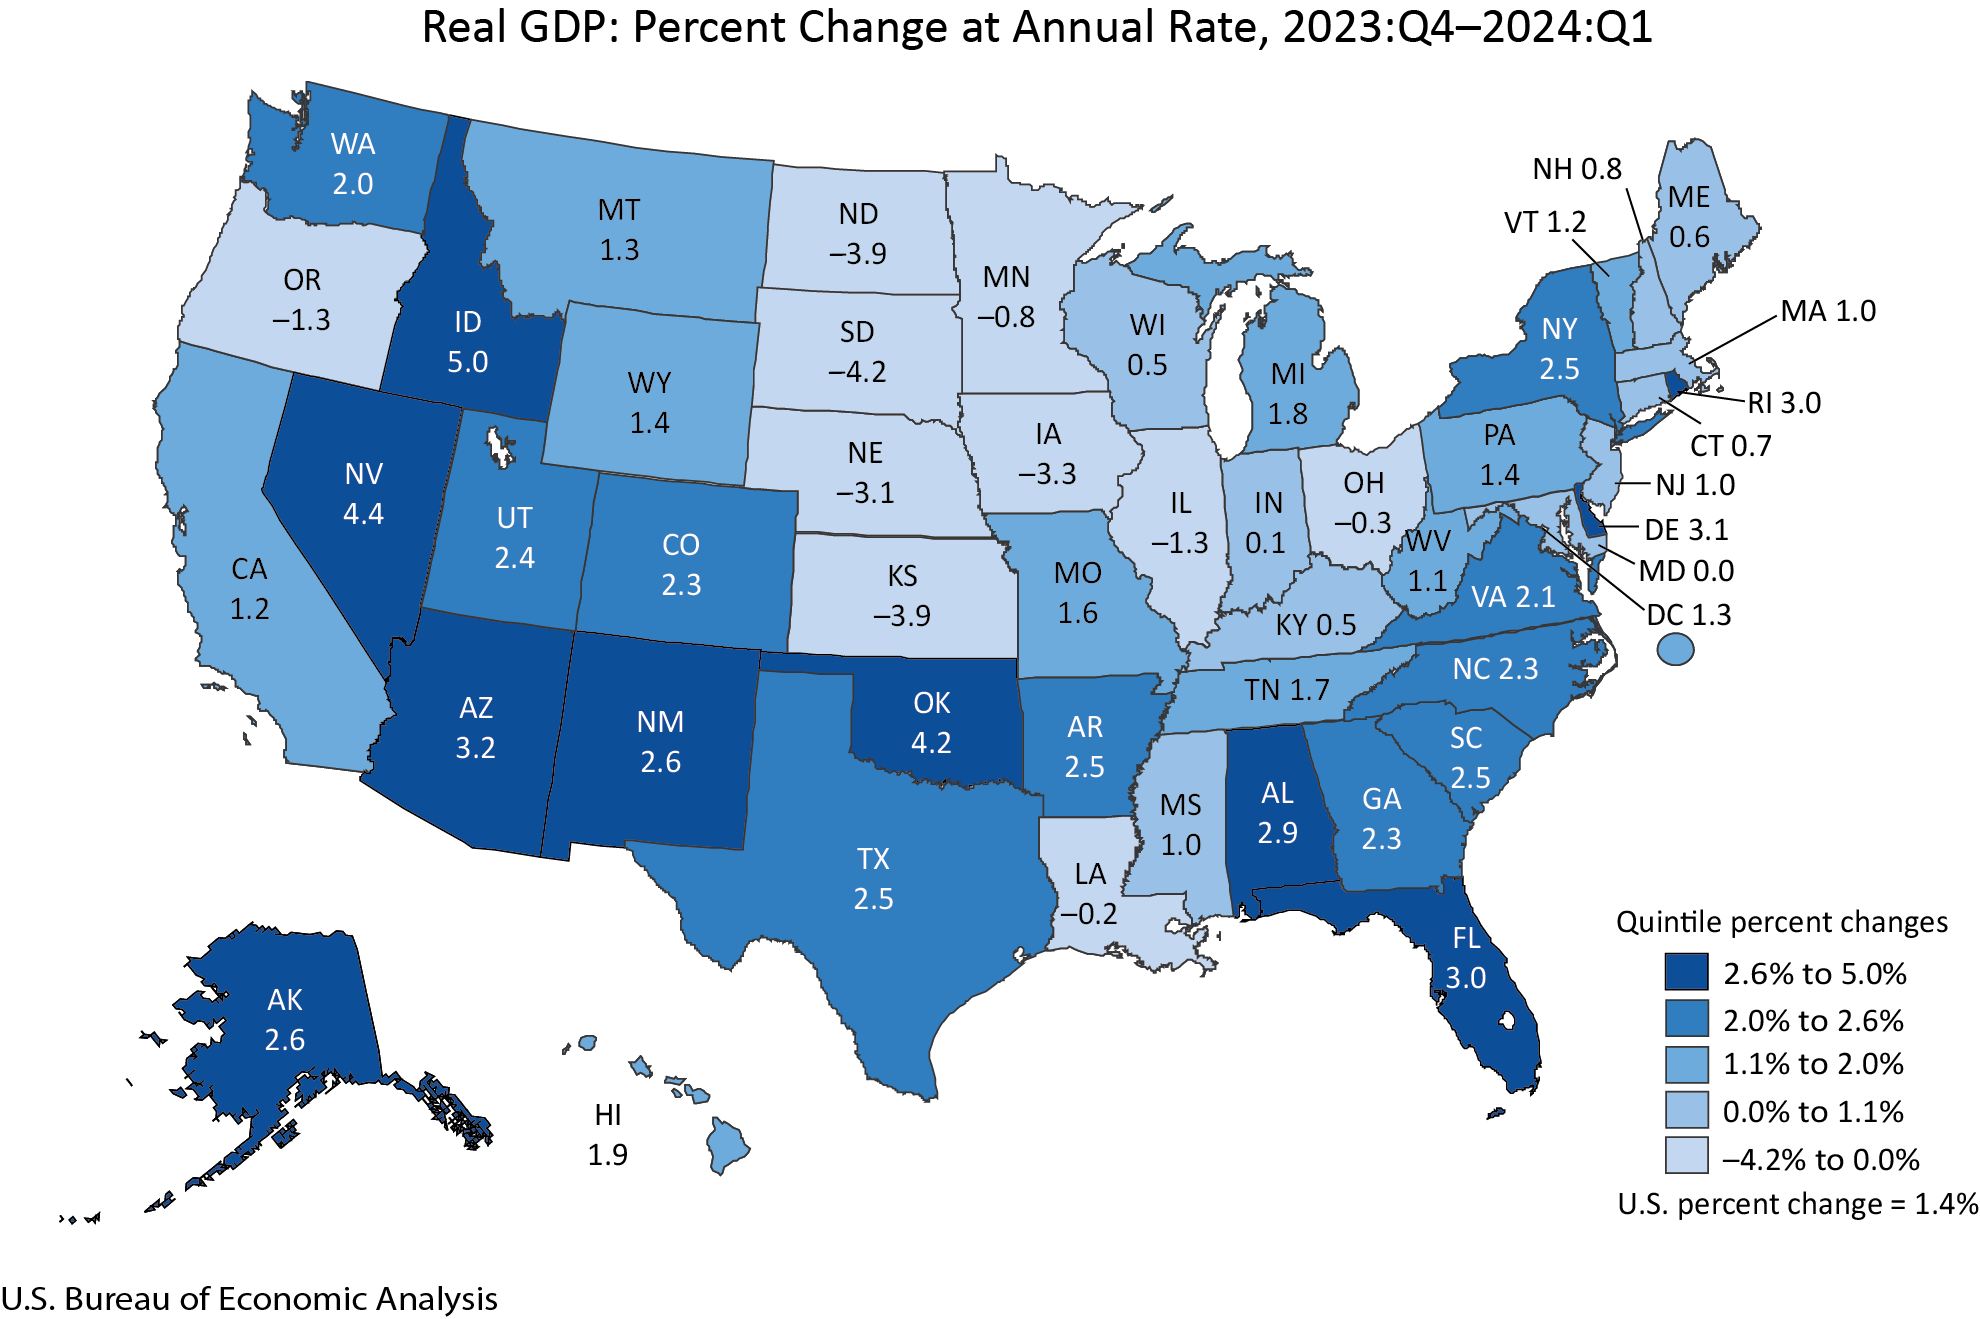
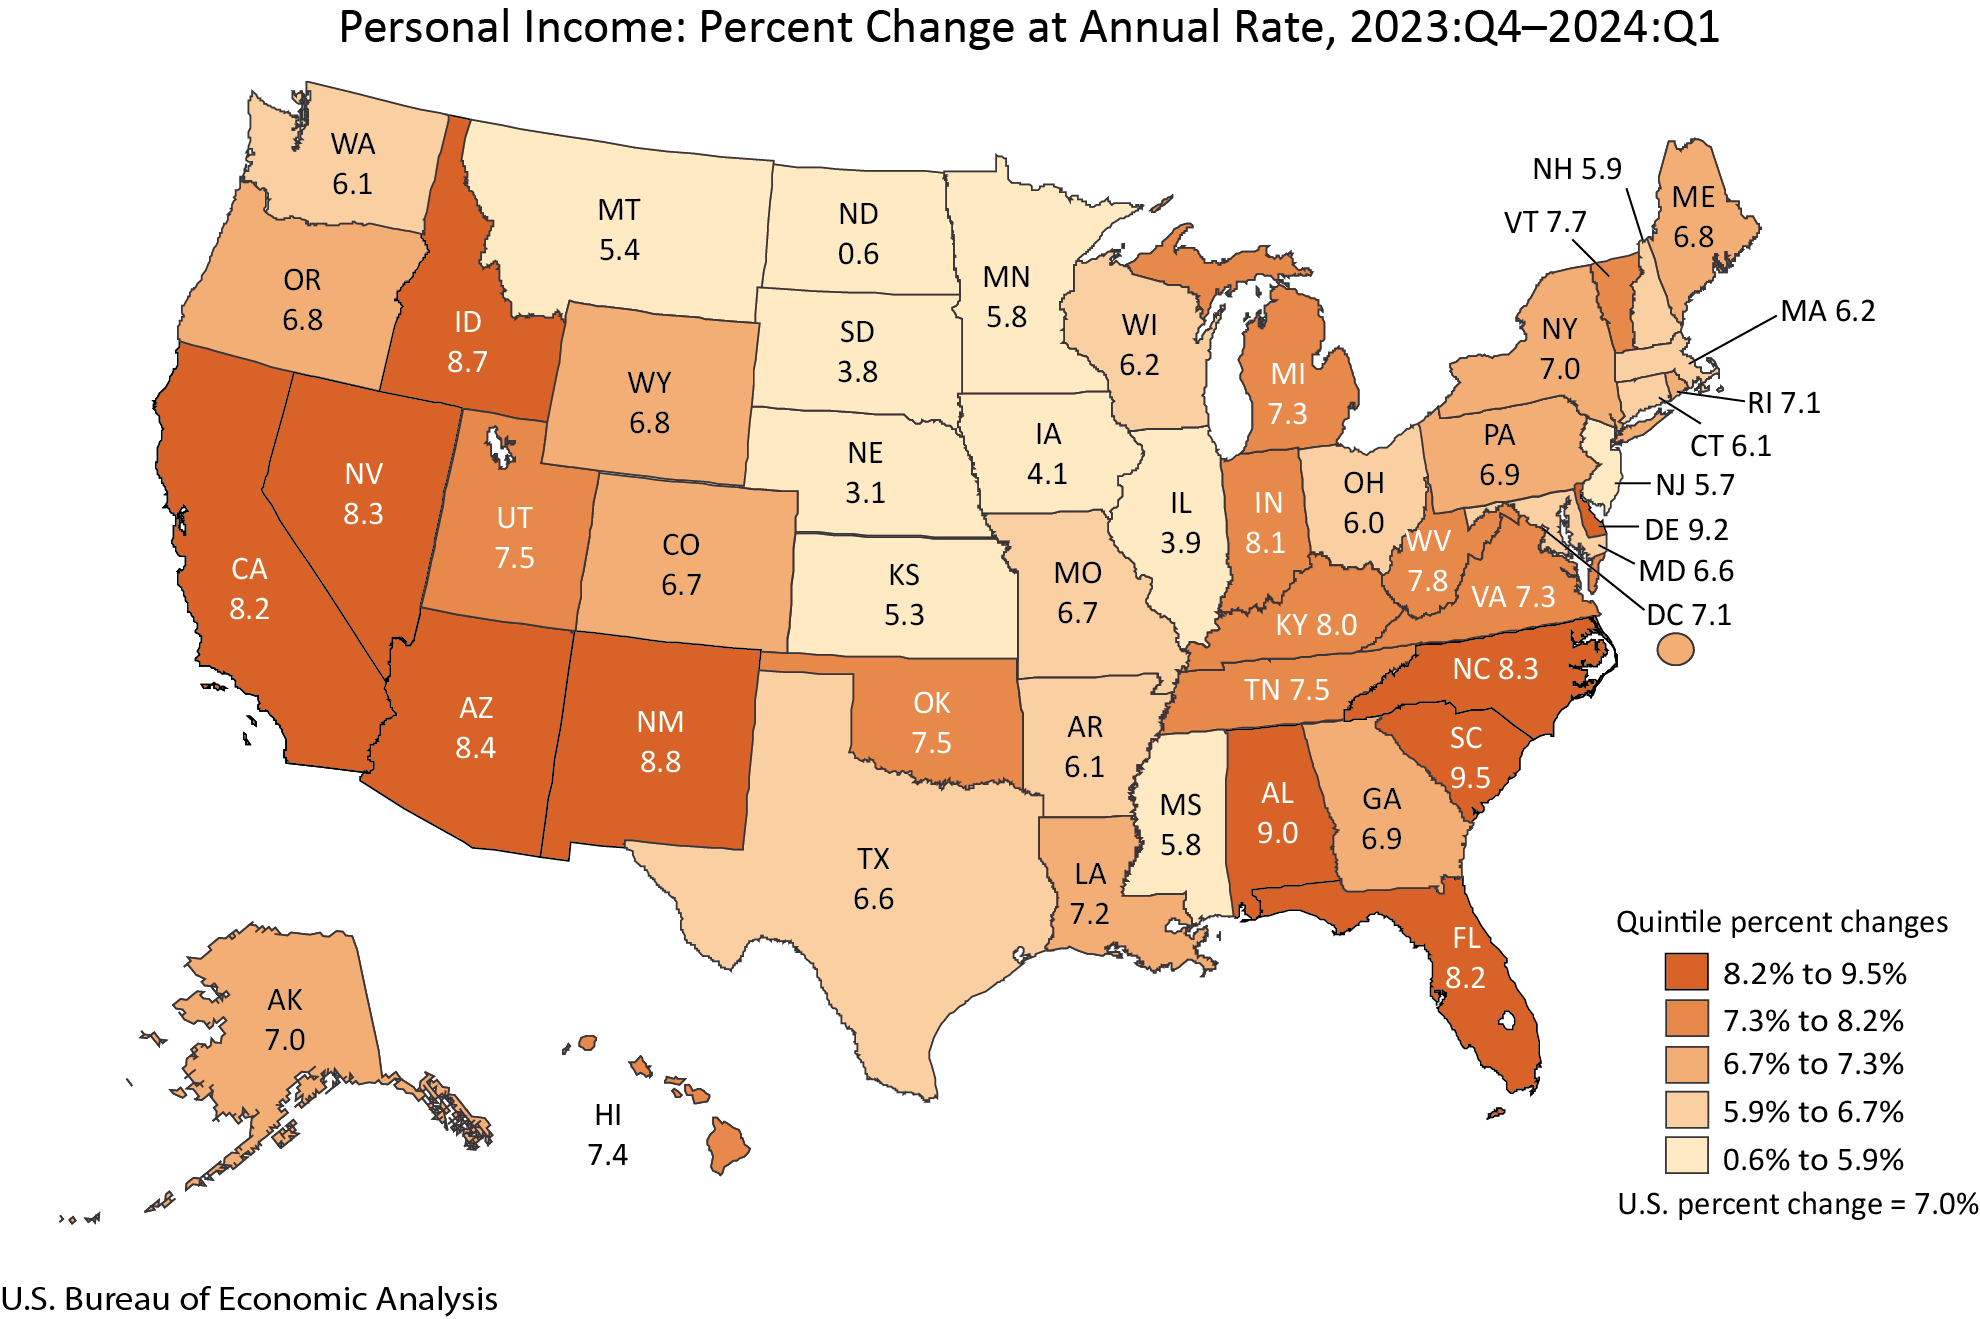
Gross Domestic Product and Personal Income by State, 1st Quarter 2024: Maps: Bureau of Economic Analysis
Posted By Milton Recht
From Bureau of Economic Analysis, "Gross Domestic Product by State and Personal Income by State, 1st Quarter 2024:"
 |
| Source: Bureau of Economic Analysis |
 |
| Source: Bureau of Economic Analysis |
Tuesday, May 28, 2024
Negative Effects Of Estate Tax: Decreases Our Standard Of Living By Lowering Savings And Investments Through Over-Consumption: Reprint With 7 Minute Video
Posted By Milton Recht
Reprint below of my October 27, 2011, blog post, "Estate Tax Decreases Our Standard Of Living Through Over-Consumption And Lower Savings And Investment:"
Thursday, October 27, 2011
Estate Tax Decreases Our Standard Of Living Through Over-Consumption And Lower Savings And Investment
Posted By Milton Recht
Video of Steve Landsburg, professor of economics at the University of Rochester, about research on the estate tax.
The estate tax causes over spending, lowers investment and savings, and decreases gains to our well-being and standard of living.
(HT: Businomics Blog, Bill Connerly, PhD)
The estate tax causes over spending, lowers investment and savings, and decreases gains to our well-being and standard of living.
(HT: Businomics Blog, Bill Connerly, PhD)
Thursday, May 23, 2024
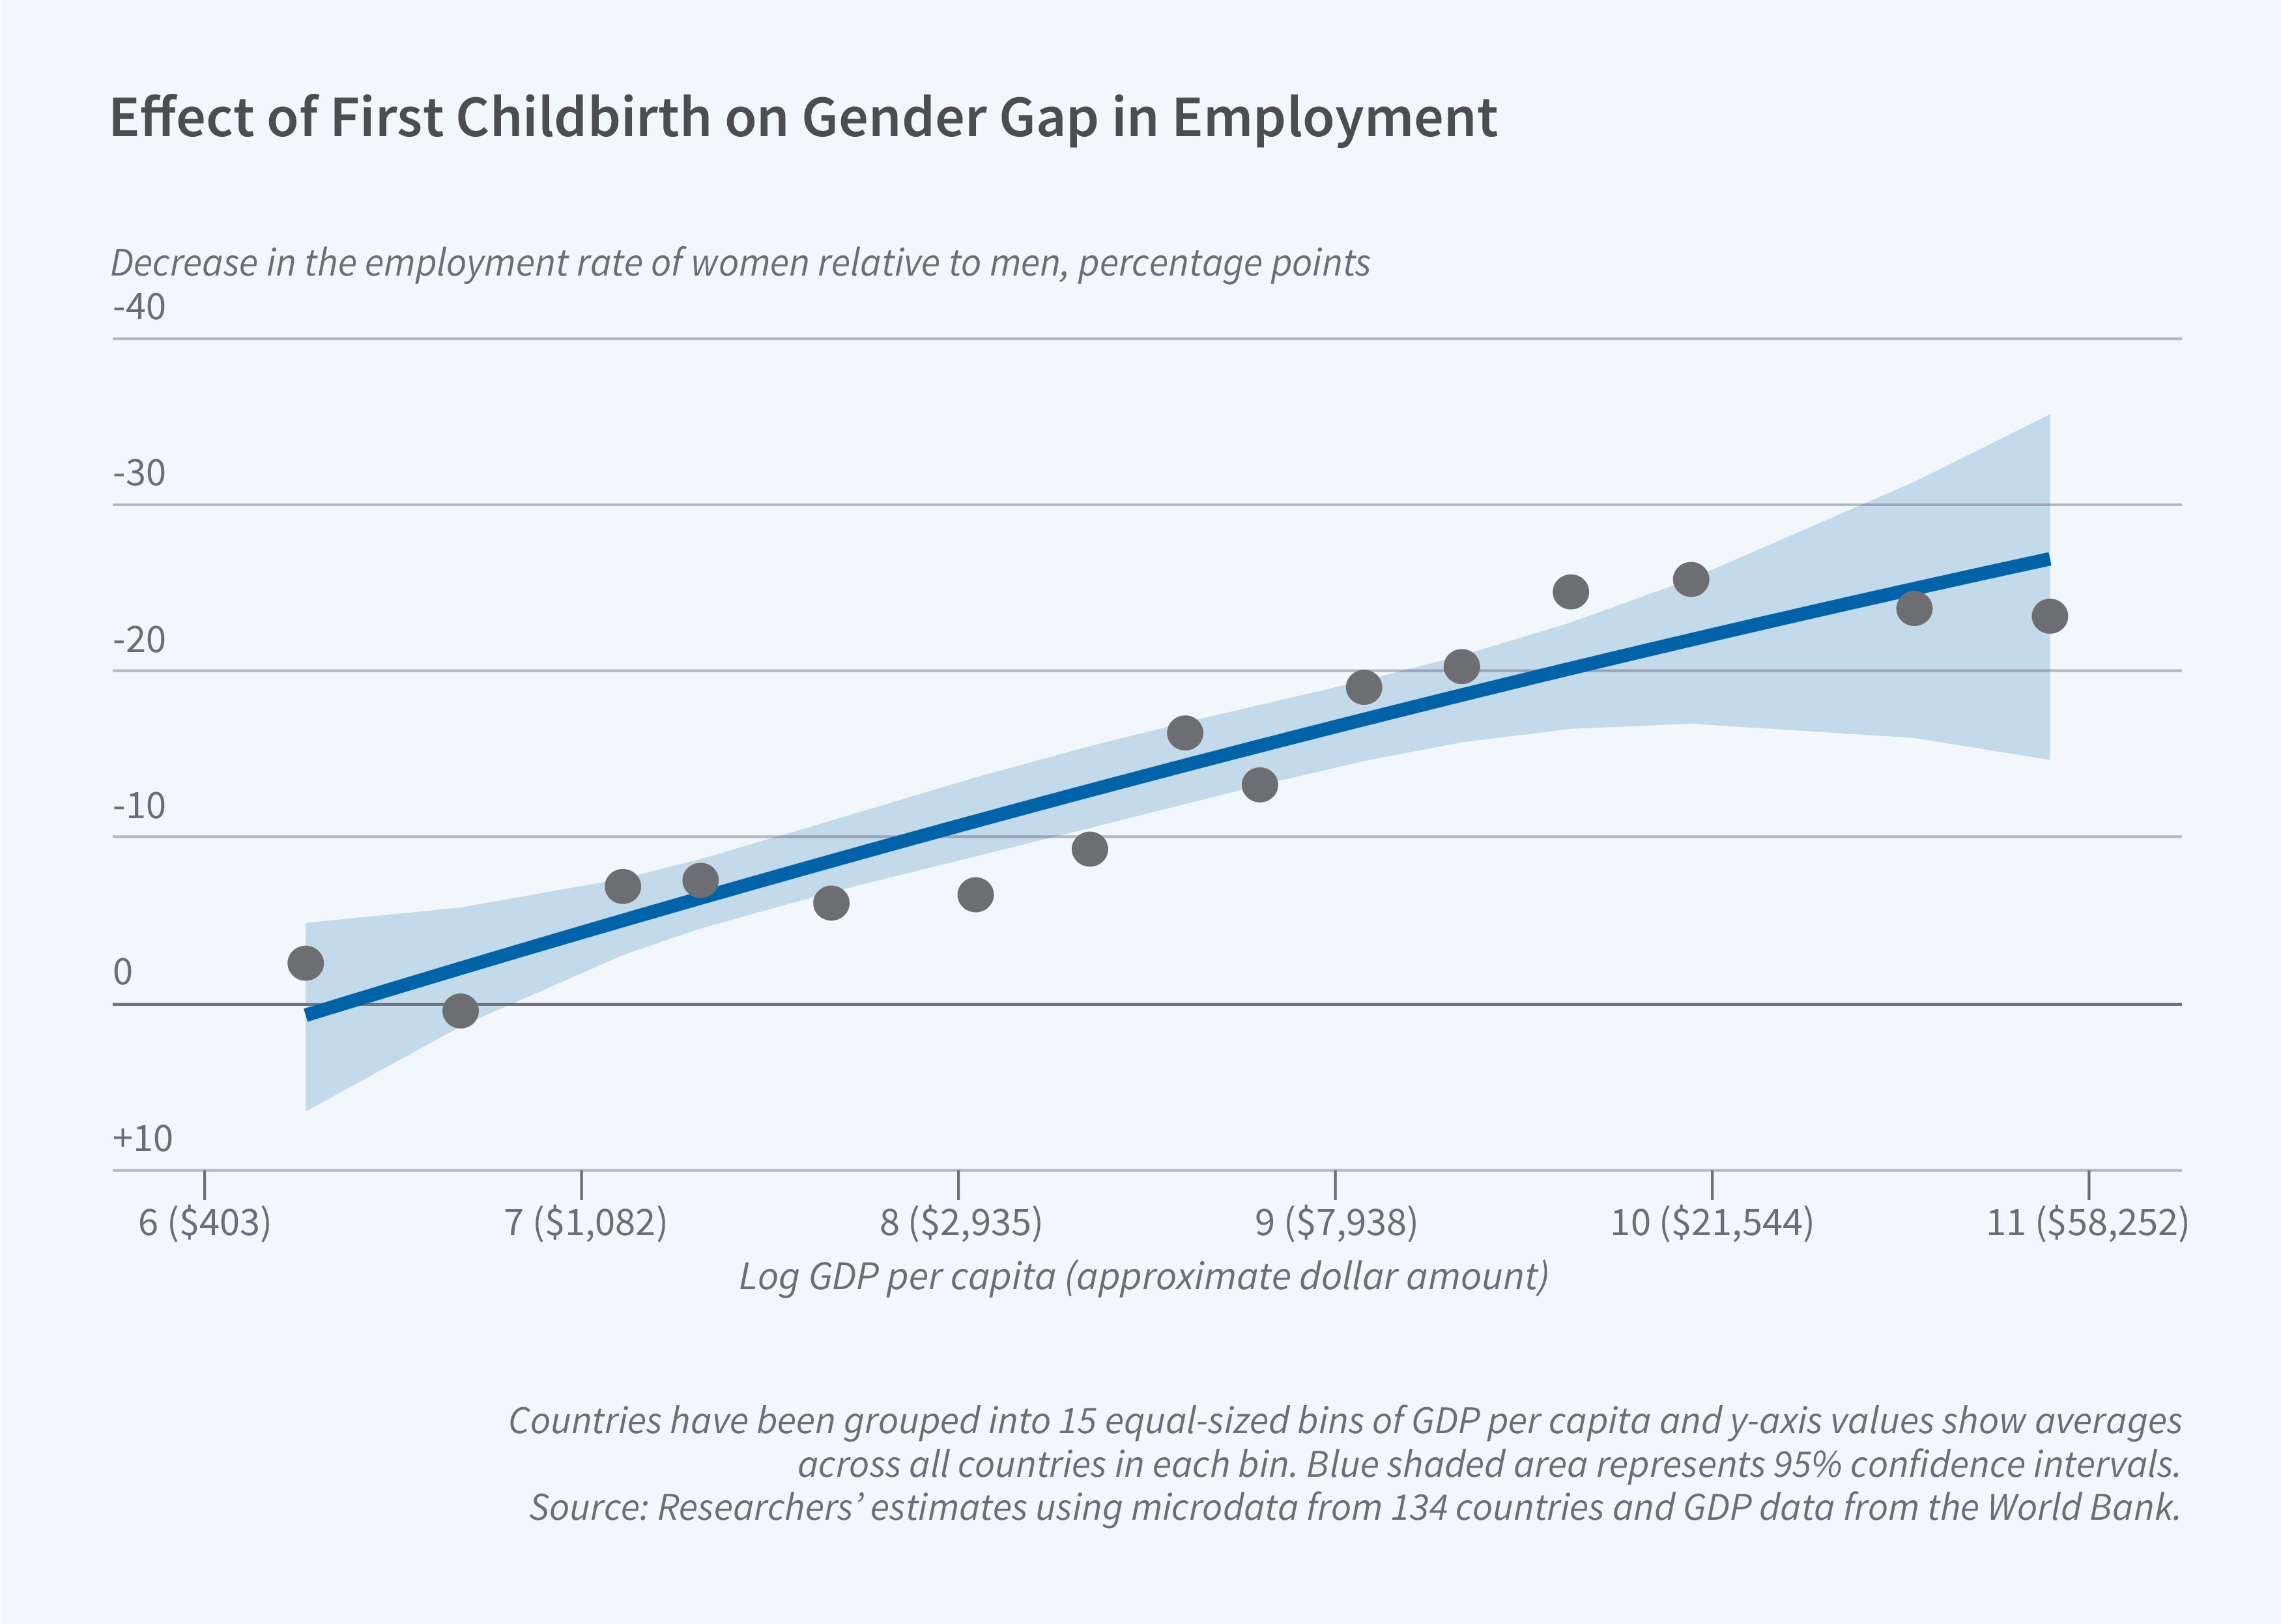
Childbearing Increases Women’s Unemployment Gap, As Countries Develop, Incomes Rise, And Economies Transition From Farming To Industry And Services Salaried Work
Posted By Milton Recht
From NBER, The Digest, "Global Evidence on Childbearing and Women’s Employment," Summary of Working Paper 31649:
 |
| Source: NBER, The Digest |
From "The Child Penalty Atlas" by Henrik Kleven, Camille Landais, and Gabriel Leite-Mariante, NBER Working Paper No. 31649, August 2023, Revised February 2024:*** As incomes rise and economies transition from subsistence farming toward salaried work in industry and services, childbearing has a larger negative effect on women’s employment.
This paper builds a world atlas of child penalties in employment based on micro data from 134 countries. The estimation of child penalties is based on pseudo-event studies of first child birth using cross-sectional data. The pseudo-event studies are validated against true event studies using panel data for a subset of countries. Most countries display clear and sizable child penalties: men and women follow parallel trends before parenthood, but diverge sharply and persistently after parenthood. While this pattern is pervasive, there is enormous variation in the magnitude of the effects across different regions of the world. The fraction of gender inequality explained by child penalties varies systematically with economic development and proxies for structural transformation. At low levels of development, child penalties represent a minuscule fraction of gender inequality. But as economies develop — incomes rise and the labor market transitions from subsistence agriculture to salaried work in industry and services — child penalties take over as the dominant driver of gender inequality. The relationship between child penalties and development is validated using historical data from current high-income countries, back to the 1700s for some countries. Finally, because parenthood is often tied to marriage, we also investigate the existence of marriage penalties in female employment. In general, women experience both marriage and child penalties, but their relative importance depends on the level of development. The development process is associated with a substitution from marriage penalties to child penalties, with the former gradually converging to zero.
Monday, May 13, 2024
US Unemployment And Labor Force Charts By Education Level From CalculatedRisk
Posted By Milton Recht
From CalculatedRisk, "Trends in Educational Attainment in the U.S. Labor Force" by Bill McBride, Sunday, May 12, 2024:
The first graph shows the unemployment rate by four levels of education (all groups are 25 years and older) through April 2024.*** Clearly education matters with regards to the unemployment rate, with the lowest rate for college graduates at 2.2% in April, and highest for those without a high school degree at 6.0% in April.
 |
| Source: CalculatedRisk |
*** This brings up an interesting question: What is the composition of the labor force by educational attainment, and how has that been changing over time?
Here is some data on the U.S. labor force by educational attainment since 1992.
 |
| Source: CalculatedRisk |
Currently, over 64 million people (25 and over) in the U.S. labor force have a bachelor's degree or higher.
This is over 44% of the labor force, up from 26.2% in 1992.
Friday, May 3, 2024
US Budget and Economic Outlook May 2, 2024 Presentation by Phillip Swagel, CBO’s Director
Posted By Milton Recht
From "The U.S. Budget and Economic Outlook" May 2, 2024 Presentation by Phillip Swagel, CBO’s Director, at the 2024 Inforum Outlook Conference:
Monday, March 4, 2024
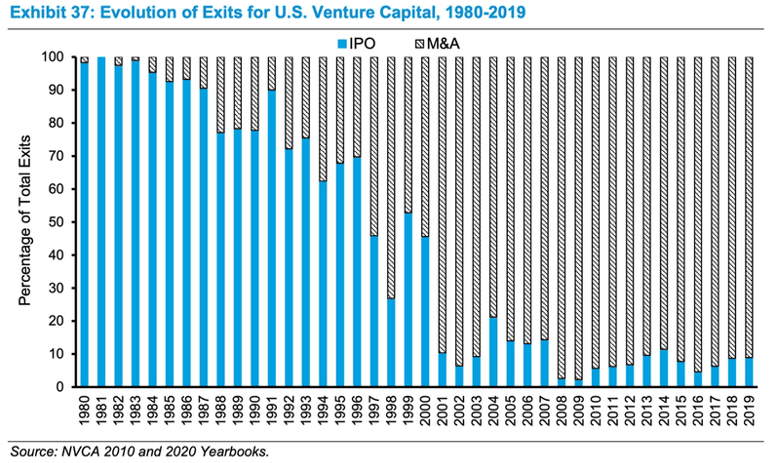
US Venture Capital Exit Evolution From IPO To M&A: Chart
Posted By Milton Recht
From Reason Foundation, "As regulators fight big tech mergers, startups often pay the price: Regulators deterred Amazon’s acquisition of iRobot. They may also have deterred innovation and future competition." by Max Gulker, Senior Policy Analyst:
The venture capital model has thereby played a critical role in democratizing entrepreneurship, and merger and acquisition (M&A) transactions are critical to the venture capital model. Around the turn of the 21st century, digital and online startups started outnumbering businesses that provide products and services mostly in the physical world. As the figure below shows, successful exits for venture capital investments in startups went from overwhelmingly IPOs to overwhelmingly M&A.
 |
| Source:Source: Merusacap Via Reason Foundation |
Many of these ultimate M&A transactions represent a startup with a unique capability of innovating along certain lines. Large companies, who may be able to distribute the technology more efficiently or create incremental improvements, seek to acquire such startups after successful venture capital funding has lessened uncertainty.
Friday, March 1, 2024
Borrowing Costs (Mortgages, Etc) Not Included In Inflation Measures (CPI, Etc): Causing Depressed Consumer Sentiment Despite Lower Inflation And Lower Unemployment
Posted By Milton Recht
From "The Cost of Money is Part of the Cost of Living: New Evidence on the Consumer Sentiment Anomaly" by Marijn A. Bolhuis, Judd N. L. Cramer, Karl Oskar Schulz & Lawrence H. Summers, Working Paper 32163, Issue Date February 2024:
Abstract Unemployment is low and inflation is falling, but consumer sentiment remains depressed. This has confounded economists, who historically rely on these two variables to gauge how consumers feel about the economy. We propose that borrowing costs, which have grown at rates they had not reached in decades, do much to explain this gap. The cost of money is not currently included in traditional price indexes, indicating a disconnect between the measures favored by economists and the effective costs borne by consumers. We show that the lows in US consumer sentiment that cannot be explained by unemployment and official inflation are strongly correlated with borrowing costs and consumer credit supply. Concerns over borrowing costs, which have historically tracked the cost of money, are at their highest levels since the Volcker-era. We then develop alternative measures of inflation that include borrowing costs and can account for almost three quarters of the gap in US consumer sentiment in 2023. Global evidence shows that consumer sentiment gaps across countries are also strongly correlated with changes in interest rates. Proposed U.S.-specific factors do not find much supportive evidence abroad.
From the paper [http://www.nber.org/papers/w32163]: These increases in the cost of living do not make it into economists’ measures of inflation, however. The CPI excludes interest payments and is up a relatively muted 20 percent since the end of 2019.5 This was not always the case. When [Arthur] Okun created his index, the measurement procedure for the CPI included measures of interest costs. This changed with the CPI redesign of 1983 (Bolhuis et al. 2022a, b). Before January of that year, homeownership variables, including housing prices and mortgage rates, entered directly into the CPI. The inclusion of these components made inflation increase mechanically at the beginning of a tightening cycle and decline once policy normalization began. It also led to a volatile series with disproportionate weight for a component—housing—that is both a consumption and an investment good. After years of research, the Bureau of Labor Statistics (BLS) moved to a system of owners’ equivalent rent, which has a stronger theoretical justification (Gillingham, 1983). Housing prices and financing costs were removed from the index. But it did not disappear from the effective costs borne by would-be home buyers or others reliant on financing due to liquidity constraints, including those borrowing to finance cars and other forms of consumption. This paper argues that this disconnect in inflation measurement, on the one hand, and actual increases in the cost of living due to higher financing costs faced by consumers, on the other, underpins the recent divergence between official inflation data and consumer sentiment. [Empahsis added.]
Friday, February 16, 2024
Lower Productivity Migrant Workers Lowers Per Capita GDP And US Prosperity: My Posted Comment To WSJ Article, "Immigration Wave Delivers Economic Windfall"
Posted By Milton Recht
My posted comment to The Wall Street Journal article, "Immigration Wave Delivers Economic Windfall. But There’s a Catch. Recent migrants are expected to be lower paid and less productive than predecessors" by Paul Kiernan:
US prosperity is better measured by real GDP per capita than total real GDP. An influx of lower paid and lower productivity migrant workers will decrease output and US prosperity per person when compared to the workers and capital investment they are crowding out. US prosperity is lowered not increased.[Blog title corrected to replace Capital with Capita.]
Thursday, February 8, 2024
Earthquake Probabilities Across The United States: A New Map Shows The Risks
Posted By Milton Recht
From ScienceNews, "Where are U.S. earthquakes most likely? A new map shows the hazard risks: The map shows the probability of damaging U.S. earthquakes over the next 100 years" by By Nikk Ogasa:
***
Some 230 million people in the United States face the potential of damaging earthquakes in 100 years, according to the latest U.S. National Seismic Hazard Model, or NSHM. That’s about 40 million more people than the NHSM previously suggested.
 |
| Source: ScienceNews |
Friday, February 2, 2024
Harvard Professor Greg Mankiw Recommends Fed Stop Giving News Conferences
Posted By Milton Recht
From Greg Mankiw's Blog, Thursday, February 01, 2024, "Memo to Fed: Stop the News Conferences":
In watching part of Jay Powell's news conference yesterday, I realized that what he is doing to just the opposite of good economics communication. When I write an article, give a lecture, or draft a textbook chapter, my goal is to convey maximum information in the fewest words possible. But when the Fed chair answers reporters' questions, he seems to be conveying the least possible information in the most words possible.*** Here is my recommendation: Stop giving news conferences. The Fed's policy decision and statement should stand by themselves. The Supreme Court does not give news conferences after announcing decisions. They explain their judgment once in writing and then let that stand. The Fed should do the same.
Friday, January 19, 2024
US Demographic Outlook: 2024 to 2054: CBO Projections
Posted By Milton Recht
From Congressional Budget Office, "The Demographic Outlook: 2024 to 2054" January 2024:
Full CBO document available in PDF format here.
Projected changes in the size of the U.S. population, as well as its age and sex composition, significantly affect the outlook for the economy and the federal budget. For example, the number of people who are employed and paying taxes on their wages depends on the size of the population ages 25 to 54, and the number of beneficiaries of some federal programs (including Social Security and Medicare) depends on the size of the population age 65 or older.*** In CBO’s projections, the population increases from 342 million people in 2024 to 383 million people in 2054, growing by 0.4 percent per year, on average, or by less than one-half the pace experienced from 1974 to 2023 (0.9 percent per year). Over the next decade, immigration accounts for about 70 percent of the overall increase in the size of the population, and the greater number of births than deaths accounts for the remaining 30 percent. After 2034, net immigration increasingly drives population growth, accounting for all population growth beginning in 2040. (For a comparison of CBO’s population projections with those of other agencies, see Appendix A.)
CBO’s projections of the population over the 2024–2054 period are highly uncertain, especially in later years. If rates of fertility, mortality, or net immigration were higher or lower than in the agency’s projections, then the resulting population would differ from the amounts shown here. The effects would be larger in later years of the projection period than in the earlier years because differences in those rates compound in each year of the period.
 |
| Source: CBO, Graphic by R L Rebach |
Full CBO document available in PDF format here.
Monday, January 15, 2024
Young Black Americans Increasingly Investing In Stock Market
Posted By Milton Recht
From The Wall Street Journal, Personal Finance, "Black Investors Are the Biggest New Group of Stock Buyers: Mobile apps, social media and word-of-mouth are reshaping the makeup of the market" by Oyin Adedoyin and Sanaa Rowser:
Young Black Americans are among the fastest-growing segments of stock-market investors.
Nearly 40% of Black Americans owned stocks in 2022, up from just under a third in 2016, according to the most recent Federal Reserve data. During that same period, the share of white households with stocks grew to nearly two-thirds, up from 61%. This was all before the stock market’s 2023 rally.
This growth seems to be driven in part by younger investors, surveys suggest. They embraced the market in a retail-investing boom fueled by mobile apps, commission-free trading, participation in 401(k)s, crypto, meme stocks and social media, researchers said. Nearly 70% of Black respondents under 40 years old were investing, compared with roughly 60% of white investors in the same age group in 2022, according to a survey by Ariel Investments and Charles Schwab. [Emphasis and Survey weblink added.]
Subscribe to:
Comments (Atom)