Older adults are now the largest age group seeking help in narcotic painkiller and heroin treatment programs, a study based in New York City found.*** People aged 50 to 59 accounted for about 8 percent of narcotic painkiller and heroin treatment patients in 1996, but they represented nearly 36 percent in 2012. The proportion of patients aged 60 to 69 also rose dramatically, from 1.5 percent to 12 percent, the study revealed.
"These increases are especially striking, considering there was about a 7.6 percent decrease in the total patient population over that period of time, and suggests that we are facing a never before seen epidemic of older adults with substance use disorders and increasing numbers of older adults in substance abuse treatment," Han said.
The proportion of such patients aged 40 and younger fell from about 56 percent in 1996 to about 20 percent in 2012, the study showed.
Friday, November 27, 2015
Huge Increase In Opioid Addiction Among Seniors
From the National Institutes of Health, MedlinePlus, "Those in Their 50s Now Largest Group Battling Addiction to Narcotics: Study: Big jump also seen in those aged 60 and older needing treatment for painkiller, heroin abuse" by Robert Preidt:
Friday, November 20, 2015
Uncertainty Forecast Ranges Of CBO's Long-Term Budget Projections
From Congressional Budget Office, "The Uncertainty of Long-Term Budget Projections" Presentation by Ben Page:
CBO’s long-term budget projections generally reflect current law and estimates of future economic conditions and demographic trends. Those projections depend on estimates of the future paths of mortality rates, productivity, interest rates, and health care costs, among many other variables. To illustrate some of the uncertainty about long-term budgetary outcomes, CBO constructed alternative projections showing what would happen to the budget if those factors differed from the values used in the extended baseline.
Thursday, November 19, 2015
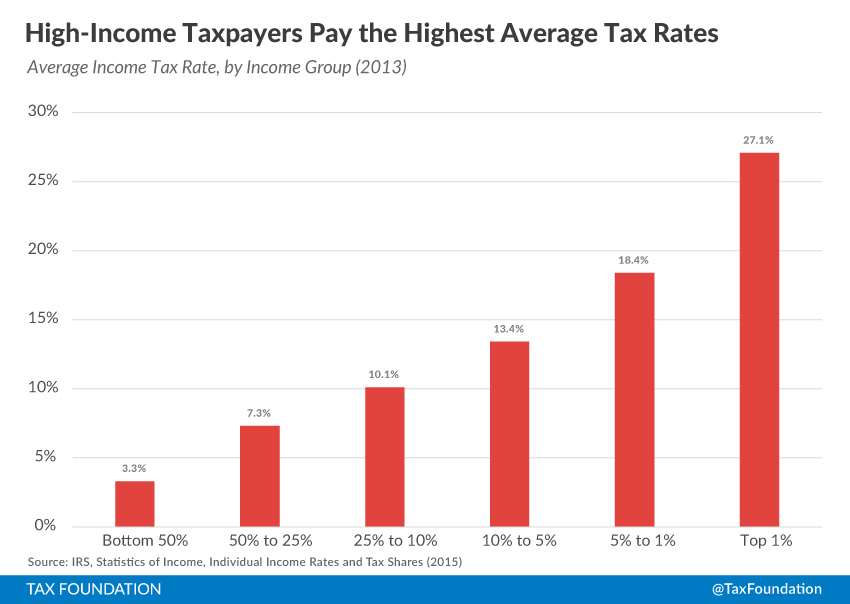
High-Income Americans Pay The Majority of Federal Taxes And Pay The Highest Average Tax Rates
From Tax Foundation, "Summary of the Latest Federal Income Tax Data, 2015 Update" by Scott Greenberg:
High-Income Americans Paid the Majority of Federal Taxes
In 2013, the bottom 50 percent of taxpayers (those with AGIs below $36,841) earned 11.49 percent of total AGI. This group of taxpayers paid approximately $34 billion in taxes, or 2.78 percent of all income taxes in 2013.
In contrast, the top 1 percent of all taxpayers (taxpayers with AGIs of $428,713 and above), earned 19.04 percent of all AGI in 2013, but paid 37.80 percent of all federal income taxes.
In 2013, the top 1 percent of taxpayers accounted for more income taxes paid than the bottom 90 percent combined. The top 1 percent of taxpayers paid $465 billion, or 37.80 percent of all income taxes, while the bottom 90 percent paid $372 billion, or 30.20 percent of all income taxes.
Chart 1.
 |
| Source: Tax Foundation |
*** Chart 2.
 |
| Source: Tax Foundation |
Wednesday, November 18, 2015
US Annual Solar Photovoltaic (Solar Panel) Installations In Megawatts
From The Wall Street Journal, Journal Reports: Energy, "Will Solar Energy Plummet if the Investment Tax Credit Fades Away? Many solar supporters say the loss or reduction of the credit will be a ‘cliff’ for the industry. But others say the credit’s impact is overstated and solar will continue to grow:"
Source: The Wall Street Journal

Tuesday, November 17, 2015
States With The Worst And Best Business Tax Climates
From Tax Foundation, "2016 State Business Tax Climate Index" by Jared Walczak, Scott Drenkard, Joseph Henchman:
The Index is designed to show how well states structure their tax systems, and provides a roadmap for improvement.
The 10 best states in this year’s Index are:1. Wyoming
2. South Dakota
3. Alaska
4. Florida
5. Nevada
6. Montana
7. New Hampshire
8. Indiana
9. Utah
10. Texas*** The 10 lowest ranked, or worst, states in this year’s Index are:
41. Maryland
42. Ohio
43. Wisconsin
44. Connecticut
45. Rhode Island
46. Vermont
47. Minnesota
48. California
49. New York
50. New Jersey
Lower Percentage Of College Students Are Graduating
From The Wall Street Journal, "College Graduation Rate Shrinks, Study Finds: Research shows just 52.9% of students who began four-year programs in fall 2009 had graduated" by Melissa Korn:
Just 52.9% of students who began four-year programs in fall 2009 had graduated from such institutions within six years, according to a report released Tuesday by the National Student Clearinghouse Research Center, compared with 55% for the class that started in 2008 and 56.1% the year before that.*** But students of all ages, and at all types of institutions, completed school at a lower rate than those who started down the college path the prior year.*** Though a smaller percentage of students made it to the finish line this year, the total number of graduates increased by about 71,000 for the latest class, since more students—2.9 million—entered college in 2009 than in the prior year.
Monday, November 16, 2015
US Government Guaranteed 75 Percent Of New Mortgages For Home Purchases In 2015: Up From 30 Percent In 2006
From The Washington Post, Opinion, "Why Fannie Mae and Freddie Mac survived" by Robert J. Samuelson:
Here are the numbers. Fannie and Freddie provide government mortgage guarantees (i.e., if homeowners default, the GSEs repay mortgage investors in full). In 2015, GSE guarantees cover about half of new mortgages for home purchases; including other agencies — the Federal Housing Administration, which caters to lower-income borrowers, and Veterans Affairs — the government guarantees three-quarters of new mortgages. By contrast, the government’s share in 2006 was slightly more than 30 percent, with the GSEs representing most of that.
We have effectively nationalized housing finance. Private money retreated, and the GSEs have returned to profitability — with all the profits going to the U.S. treasury.
Wednesday, November 11, 2015
CBO Overestimates Total Revenue By 1.1 Percent On Average With A Mean Absolute Error Of 5.2 Percent
From The Congressional Budget Office, November 10, 2015 Report, "CBO’s Revenue Forecasting Record:"
How Accurate Have CBO's Two-Year Revenue Projections Been?
On average, CBO has overestimated total revenues by 1.1 percent in its two-year projections—those that provide estimates of revenues for the fiscal year following the year in which they are released. A misestimate of that size in its January 2015 baseline projection, for example, would amount to $37 billion out of the roughly $3.5 trillion in total revenues that CBO projected for fiscal year 2016. Overestimates and underestimates offset one another in the mean error measure, so that average overestimate of 1.1 percent over the past three decades includes projections for years in the latest recession for which CBO overestimated revenues by as much as 25 percent and projections for the late 1990s and the mid-2000s for which CBO underestimated revenues by nearly 10 percent (see the figure below). The calculation of those errors—and of all such measures cited in this report—includes an adjustment to remove the estimated effects of legislation enacted after the projections were produced. That adjustment is necessary because the baseline projections incorporate the assumption that current laws governing taxes will generally not be modified by future legislation.
Source: CBO *** In addition to the mean error, CBO employs two other commonly used measures to evaluate the accuracy of revenue projections: the root mean square error (RMSE) and the mean absolute error. Unlike the mean error, the mean absolute error is the average of the errors without regard to direction (the negative signs are removed from underestimates before averaging), so errors in different directions do not offset one another. The RMSE, the calculation of which involves squaring the errors (thus removing the negative signs), also measures the size of errors without regard to direction, but by squaring the errors, it places a greater weight on larger deviations. The mean absolute error is an easier measure to understand, but the RMSE may be a more useful measure of forecast errors for revenue projections because larger forecast errors may have a disproportionately greater cost for policymaking than smaller ones.
For CBO's two-year revenue projections made since 1982, the mean absolute error is 5.2 percent, and the RMSE is 7.4 percent (see the table below). A mean absolute error of that magnitude would correspond to an error of about $180 billion in the revenue estimate for 2016 that CBO released in its January 2015 baseline projections. Because a disproportionate share of the misestimates occurred in projections made in years immediately preceding recessions, both the RMSE and the mean absolute error are roughly one-third smaller when the four two-year projections (out of the 32 included in this analysis) that were produced at or near peaks in the business cycle are excluded.
Source: CBO
*** How Efficiently Has CBO Incorporated New Information?
CBO has tended to revise consecutive revenue forecasts in the same direction, suggesting that the agency does not efficiently incorporate new information into its forecasts. That tendency was less pronounced in the past 15 years than it was in the previous period, although the limited number of forecasts that can be assessed makes it difficult to conclude that CBO has improved its use of new information. That tendency, furthermore, has varied significantly over the entire history of CBO's forecasts, and CBO's forecast accuracy would not have been systematically improved had the agency incorporated into its forecasts what was known at the time about that tendency; such modifications would have over adjusted the forecasts in many cases.


Tuesday, November 10, 2015
Low Calorie Sweeteners Help Reduce Body Weight
From "Low energy sweeteners help reduce energy intake and body weight" in ScienceBlog:
Use of low energy sweeteners (LES) in place of sugar, in children and adults, leads to reduced calorie intake and body weight – and possibly also when comparing LES beverages to water – according to a review led by researchers at the University of Bristol published in the International Journal of Obesity today.Study published in "Does low-energy sweetener consumption affect energy intake and body weight? A systematic review, including meta-analyses, of the evidence from human and animal studies" by Rogers et al in the International Journal of Obesity.
For the first time, all available science was integrated into a single review to evaluate the real impact of LES, such as saccharin, aspartame, sucralose and stevia, on energy intake (EI) and body weight (BW) over the short- and long-term. A considerable weight of evidence confirmed that consuming LES instead of sugar helps reduce relative energy intake and body weight.*** The authors conducted systematic reviews of relevant studies in animals and humans consuming LES in a non-restricted diet. In total, 12 human prospective cohort studies, 228 comparisons in human intervention studies (short and long-term) and 90 animal studies were examined.
Monday, November 9, 2015
S&P 500 Vs Hedge Fund Returns Since 2001 Chart
From BloombergView, "The Reason Pension Plans Stick With Hedge Funds" by Barry Ritholtz:
Source: BloombergView

Wage Inequality Growth Caused By Some Firms Paying Higher Salaries To All Workers And Not Selective Pay Growth Within Firms or CEO Salaries
From The Wall Street Journal, Real Time Economics, "What’s Driving Inequality: CEO Pay or Company Success?" by Greg Ip:
Prior to this research, it was known that larger forms tend to pay more for the same job than smaller firms and that some industries pay more for a job function than others. For example, hospitals pay janitors a higher salary than other companies; technology firms pay more for computer programmers than industrial companies, etc. What the study mentioned above shows is that the growth in wage inequality is due to the differences in growth in pay across firms and industries and not due to selective pay growth within firms.
A National Bureau of Economic Research paper caused a stir earlier this year by claiming all of the rise in inequality since 1980 was between firms, not within firms, implying executive pay played no role.From The Wall Street Journal, "Behind Rising Inequality: More Unequal Companies: More competition would help narrow the gap between the highest- and lowest-paid employees" by Greg Ip:
The paper [Firming Up Inequality], by Jae Song of the Social Security Administration, David J. Price and Nicholas Bloom of Stanford University, Fatih Guvenen of the University of Minnesota and Till von Wachter of the University of California, Los Angeles, looked at a large sample of more than 100 million employees and linked their pay to the average pay within their own firm.
They found that while incomes of the highest-paid workers (e.g., those earning more than 90% or 99% of all others) had indeed grown faster than the median, they had not grown faster than those of their co-workers. For example, the employee at the 90th percentile earned 1.69 times as much as his firm’s average wage in 1980, and 1.73 times as much in 2013. An employee at the 99th percentile earned 3.57 times his firm’s average in 1980, and 3.48 times in 2013.
From this they concluded that "virtually all of the rising dispersion between workers" was caused by the dispersion between firms, contradicting Thomas Piketty, author of "Capital in the Twenty-First Century," and others who say it’s due to the top 1% pulling away.
Mounting evidence suggests the prime driver of wage inequality is the growing gap between the most- and least-profitable companies, not the gap between the highest- and lowest-paid workers within each company. That suggests policies that have focused on individuals, from minimum wages to education, may not be enough to close the pay gap; promoting competition between companies such as through antitrust oversight may also be important.
*** Separate research suggests that pay has closely followed these companies’ fortunes. Jae Song of the Social Security Administration and four co-authors [Firming Up Inequality] looked at pay records of more than 100 million workers between 1980 and 2013, and compared their pay to that of other workers at the same firm. Workers at the 90th and 99th percentile did see their pay rise much more than median and lower-paid workers over the period. But no such disparity appeared among co-workers at the same firm: the ratio of their pay to their firm’s average remained flat. In other words, everyone at the top companies, from the lowest to highest paid, pulled away from the pack, and everyone at the bottom companies languished.
Source: The Wall Street Journal

Prior to this research, it was known that larger forms tend to pay more for the same job than smaller firms and that some industries pay more for a job function than others. For example, hospitals pay janitors a higher salary than other companies; technology firms pay more for computer programmers than industrial companies, etc. What the study mentioned above shows is that the growth in wage inequality is due to the differences in growth in pay across firms and industries and not due to selective pay growth within firms.
Industries With Most Lobbyists
From The Wall Street Journal, "Colleges Flex Lobbying Muscle: With campuses, jobs in every district, schools push Congress to sink new rules" by Brody Mullins, Douglas Belkin and Andrea Fuller:
Source: The Wall Street Journal

Saturday, November 7, 2015
Like A Movie Actor Whose Onscreen Decisions Do Not Impact The Real Lives Of The Movie Going Audience, Obama's Keystone Pipeline Rejection Does Not Affect Canadian Oil Imports Into The US Or Decrease Carbon Output
From The Washington Post, "Obama rejects Keystone XL project, citing U.S. climate leadership" by Juliet Eilperin and Steven Mufson:
Rail transport has expanded to carry oil sands to the United States, soaring from just 16,000 barrels in 2010 to 51.2 million barrels in 2014 before dropping somewhat this year. But rail transport is more expensive than pipeline transport. And the extra cost looms larger in light of current oil prices, which are about half what they were for much of the past six years.From The New York Times, "Citing Climate Change, Obama Rejects Construction of Keystone XL Oil Pipeline" by Coral Davenport:
Yet the final rejection of the Keystone XL project was widely expected in the oil industry, and many companies have already made other plans. U.S. imports of oil from Canada hit a record high of 3.4 million barrels a day in August, up from just under 2 million barrels a day in 2008, the year the pipeline was proposed. That has happened even as U.S. domestic oil production has risen by more than half and despite delays in Keystone XL. [Emphasis added.]
But numerous State Department reviews concluded that construction of the pipeline would have little impact on whether that type of oil was burned, because it was already being extracted and moving to market via rail and existing pipelines. [Emphasis added.]
Friday, November 6, 2015
Junk Food And Soda Are Not Causing Obesity Epidemic
From MarketWatch, "Soda and junk foods are not making you fat" by Quentin Fottrell:
Soda, candy and fast-food are often blamed for the rising rates of obesity in America and, while eating any one high-calorie or high-sugar food to excess is obviously unhealthy, a major new study found that consumption of these foods is not related to Body Mass Index in 95% of the population. The report was published by the Food & Brand Lab at Cornell University in Ithaca, N.Y. "While a diet of chocolate bars and cheese burgers washed down with a Coke is inadvisable from a nutritional standpoint, these foods are not likely to be a leading cause of obesity," the study said.
Underweight Americans actually consumed more soda and sweet snacks than average-weight individuals, while overweight, obese, severely obese and morbidly obese individuals consumed less soda, sweet snacks and salty snacks than average-weight individuals. Morbidly obese people (with a BMI of 44.9 or more) ate fewer sweet snacks and salty snacks. Oddly, they did eat 50% more French fries than average-weight individuals. The researchers say people shouldn’t deprive themselves of their favorite food because that sacrifice is unlikely to be related to their weight – unless, that is, their favorite food is French fries.
So what’s the culprit? Calories in, calories out. The amount you eat versus the amount of exercise you get. Americans are eating over 500 calories more every day than they did four decades ago: 2,544 calories per day in 2010 versus 2,039 in 1970. And there are some other culprits -- aside from French fries -- but they exist across a range of meals. The number of calories consumed every day spiked for grains such as white bread (409 calories in 1970 versus 582 calories in 2010), added oil and dairy fats (346 versus 589 calories) and added sugars (333 versus 367 calories).
Source: MarketWatch ***
Source: MarketWatch
The study, which was published in the October edition of the journal Obesity Science & Practice, analyzed the consumption of these foods by nearly 6,000 people from the Centers for Disease Control’s “National Household and Nutrition Examination Survey,” and cross-referenced this data to their body mass index, used as a measure of obesity.


Monday, November 2, 2015
Moving A US Company Overseas Makes It Easier To Invest In US Due To Lower US Tax Burden
From The Wall Street Journal, Opinion, Review & Outlook,"The Corporate Tax Political Divide: Democrats are driving U.S. companies and capital offshore:" by
And yes, moving the business overseas would ironically make it easier to invest in the United States, thanks to the insane tax burden the Treasury now applies when U.S. firms want to bring profits back from overseas and invest them at home.
Mr. [Ian] Read [Pfizer Chairman and CEO] was speaking in general terms and not discussing the particulars of the potential merger his firm is now discussing with Allergan, but he neatly explained the competitiveness problem faced by U.S. companies. He noted that after paying Irish corporate income taxes, a firm based there still retains roughly 88 cents on each dollar of profits, which it can choose to invest in the U.S.
But if a U.S. company makes the same dollar in Ireland and pays the same local tax to Irish authorities, its 88-cent after-tax profit gets whittled down to 65 cents if the money is invested in the U.S. That’s because the U.S. is one of a small handful of tax collectors worldwide that demands to be paid even after a domestic company has already paid the overseas territory where it made the money.
Subscribe to:
Posts (Atom)