The New York City teachers’ union announced on Friday that it was closing the kindergarten-to-eighth-grade portion of a charter school because of students’ low scores on state tests, ending an experiment intended to prove that such schools could thrive even with strict labor rules.
Charter schools are publicly financed but privately operated, and the vast majority of charter schools in the city are not unionized, giving them flexibility to have longer hours and the power to replace teachers easily.
*** When the U.F.T. Charter School opened in 2005, Mr. Mulgrew’s predecessor, Randi Weingarten, who is now the president of the American Federation of Teachers, pledged that it would "show real, quantifiable student achievement and with those results, finally dispel the misguided and simplistic notion that the union contract is an impediment to success."
Saturday, February 28, 2015
NYC's Unionized Charter School Experiment Fails
From The New York Times, "New York City Teachers’ Union Is Closing Portion of Its Brooklyn Charter School" by Kate Taylor:
Friday, February 27, 2015
Hourly Wage Growth Chart By Sector: Restaurant Workers See Highest Hourly Pay Growth
From The Wall Street Journal, "Wages Rise at Restaurants as Labor Market Tightens: Food-service employment surges, growing twice as fast as overall payrolls" by Eric Morath And Jeffrey Sparshott:
 |
| Source: The Wall Street Journal |
Alcohol Is A Major Risk Factor For Pedestrian Deaths Of 16 And Older
From National Institutes of Health, MedlinePlus, "U.S. Pedestrian Death Rate Leveling Off, But Still Too High: Governors' safety group reports more than 2,100 killed in early 2014" by Robert Preidt:
"... nation's four most populous states -- California, Florida, Texas and New York -- accounted for 43 percent of all pedestrian deaths in the United States in 2013. Delaware and Florida had the highest rates of pedestrian deaths at nearly 3 per 100,000 residents.
In 2013, pedestrians accounted for the highest percentage of road deaths (45 percent) in Washington, D.C. In New York, pedestrians accounted for 28 percent of road deaths, followed Nevada and Delaware, where pedestrians account for 25 percent of the road deaths in each state.*** However, the report found there was a 28 percent increase in the deaths of pedestrians ages 20 to 69 between 1975 and 2013.*** Alcohol appears to be a major risk factor for pedestrian deaths. In 2013, 36 percent of pedestrians 16 and older who died had blood alcohol concentrations of .08 or higher, according to the report. [Emphasis added.]
Wednesday, February 25, 2015
Common Sources Of Foodborne Illness
From National Institutes of Health, MedlinePlus, "U.S. Officials Pinpoint Common Sources of Foodborne Illnesses: Almost 2 million Americans fall ill each year, report notes" by Robert Preidt:
...foodborne illness that strike nearly 2 million Americans each year, a U.S. government report finds.
More than 80 percent of E. coli O157 illnesses are linked to beef and vegetable row crops, such as leafy vegetables, while 77 percent of salmonella infections are associated with seeded vegetables (such as tomatoes), eggs, fruit, chicken, beef, sprouts and pork, the report showed.
About three-quarters of campylobacter illnesses are linked with dairy (66 percent) and chicken (8 percent). Most of the outbreaks caused by dairy were associated with raw milk or cheese produced from raw milk, such as unpasteurized queso fresco, officials said.
Fruit is implicated in 50 percent of listeria infections, followed by dairy at 31 percent, according to the investigators at the U.S. Centers for Disease Control and Prevention, the U.S. Food and Drug Administration and U.S. Department of Agriculture.
However, they noted there is a lack of data about listeria outbreaks, and the large role of fruit in listeria illness reflects the impact of a single outbreak linked to cantaloupes in 2011. There are also limitations in data about campylobacter outbreaks.
Monday, February 23, 2015
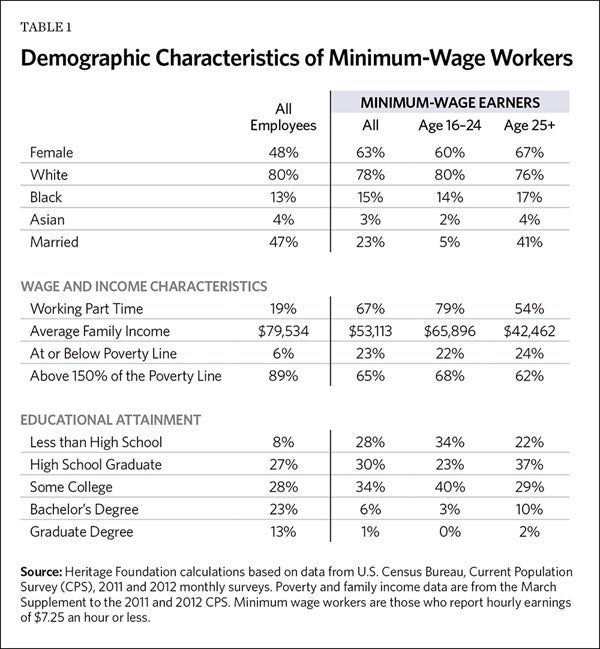
Demographic Characteristics of Minimum-Wage Earners
From The Heritage Foundation, "What is Minimum Wage: Its History and Effects on the Economy" by James Sherk, Testimony before
Health, Education, Labor, and Pensions Committee , United States Senate, June 25, 2013:
Health, Education, Labor, and Pensions Committee , United States Senate, June 25, 2013:
In 2011 and 2012, 3.7 million Americans reported earning $7.25 or less per hour—just 2.9 percent of all workers in the United States. Those who do work in minimum-wage jobs fall into two distinct categories: young workers, usually in school, and older workers who have left school. Most minimum-wage earners fall into the first category; just over half are between the ages of 16 and 24. The rest are 25 or older. Table 1 shows the characteristics of minimum wage workers overall, and broken down by age groups.
Source: Heritage Foundation
Minimum-wage workers under 25 are typically not their family’s sole breadwinners. Rather, they tend to live in middle-class households that do not rely on their earnings—their average family income exceeds $65,000 a year. Generally, they have not finished their schooling and are working part-time jobs. Over three-fifths of them (62 percent) are currently enrolled in school. Only 22 percent live at or below the poverty line, while two-thirds live in families with incomes exceeding 150 percent of the poverty line. These workers represent the largest group that would benefit directly from a higher minimum wage, provided they kept or could find a job.
Adults who earn the minimum wage are less likely to live in middle- and upper-income families. Nonetheless, three-fourths of older workers earning the minimum wage live above the poverty line. They have an average family income of $42,500 a year, well above the poverty line of $23,050 per year for a family of four. Most (54 percent) of them choose to work part time, and two-fifths are married.
Many advocates of raising the minimum wage argue it will help low-income single parents surviving on it as their only source of income. Minimum-wage workers, however, do not fit this stereotype. Just 4 percent of minimum-wage workers are single parents working full time, compared to 5.6 percent of all U.S. workers. Minimum-wage earners are actually less likely to be single parents working full time than the average American worker. [Footnotes omitted.]
Friday, February 20, 2015

The Greatest Joy In Management Life Is A Reliable Employee: Raising The Minimum Wage
From The Wall Street Journal, Opinion, "Wal-Mart’s Capitalist Payday: The giant retailer raises its minimum wage at a fortuitous time:"
Critics of capitalism promote the myth that businesses will always pay the lowest wage they can get away with. But it’s more accurate to say smart capitalists pay the wages they need to keep employees productive and contributing to growth and higher profits. More often than not this means regularly raising pay to avoid losing the best workers. As anyone who has ever hired someone knows, the greatest joy in management life is a reliable employee.*** By raising its minimum pay some 24% above the national minimum wage of $7.25, Wal-Mart will be able to outbid competitors who can’t afford the extra costs. So business self-interest elides with political inoculation.*** Wal-Mart’s decision proves that the best way to raise wages is with faster economic growth that creates more demand for labor. Workers can move to better opportunities as more emerge, and their current employers may conclude they have to pay more to keep them. And if the economy is growing faster and sales are rising, most businesses will be able to pay more. None of this requires the visible foot of government.
Wednesday, February 18, 2015
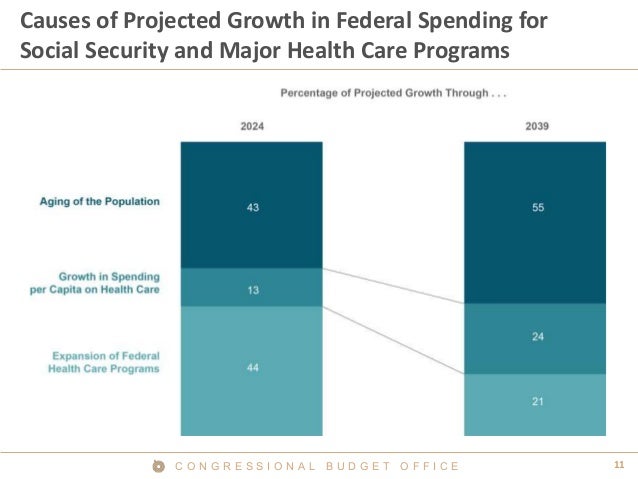
US Population Aging And Expansion Of Federal Healthcare Programs Will Be Major Causes of Increase Federal Spending On Healthcare Over Next Decade: Increase In Medical Cost Per Person Will Not Be A Major Cause Of Increase Government Spending On Healthcare
From Presentation by CBO’s Deputy Assistant Director for Health, Jessica Banthin, Ph.D., to the Joint Network on the Fiscal Sustainability of Health Systems, Organisation for Economic Co-operation and Development in Paris, France, "The Long-Term Costs of Major Health Care Programs: Fiscal Implications and Projection Methods" February 18, 2015:
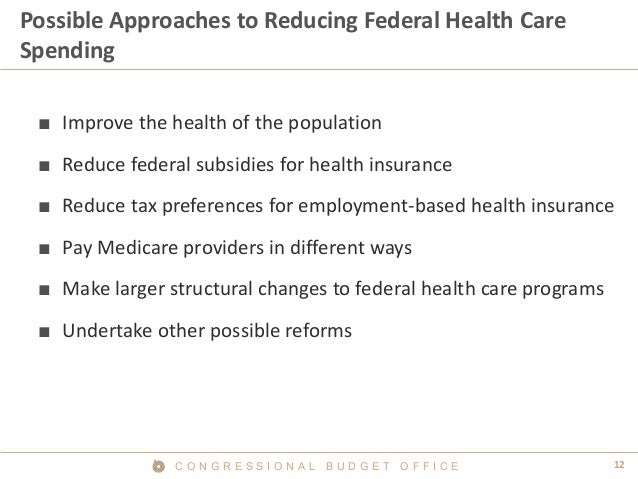
CBO's suggestions, Slide 13 below, for reducing the federal government's spending on healthcare:
As can be seen below from Slide 12 of the above presentation, expansion of federal healthcare programs and aging of the population are the major drivers of increased US government spending on healthcare over the next decade. The increase in spending on an individual user of healthcare, whether due to new technology, increase testing, or malpractice avoidance, accounts for a very small part of the increasing cost of US federal healthcare programs over the next decade.
Slide 12:
CBO's suggestions, Slide 13 below, for reducing the federal government's spending on healthcare:
Tuesday, February 17, 2015
Racial And Ethnic Differences In 401(k) Retirement Savings Behavior At Single Employer
From "Racial Disparities in Savings Behavior for a Continuously Employed Cohort" by Kai Yuan Kuan, Stanford University, Mark R Cullen, Stanford University and Sepideh Modrek, Stanford University, February 2015, NBER Working Paper No. w20937:
Abstract:
The wealth gap has reached record highs. At the same time there has been substantial proliferation of 401(k) savings accounts as the dominant retirement savings vehicle, and these accounts make up an increasing proportion of overall wealth. In this paper we examine 401(k) saving behavior of continuously employed workers over an eight-year period at a single, geographically diverse employer. We demonstrate substantial difference in 401(k) savings behavior by employee ethnicity even within a single employer 401(k) plan architecture. We show both African American and Hispanic employees are less likely to participate in the 401(k) plans. Moreover, conditional on participation African Americans contribute a lower proportion of their income to their 401(k) plan on average. We also show that African Americans and Hispanics tend to draw down on their 401(k) balances more often. Finally, we document that both African Americans and Hispanics favor safer assets within their plan options. Together these differences substantially impact the level of 401(k) balances accumulated and therefore overall wealth accumulation.
Monday, February 9, 2015
Friday, February 6, 2015
Bachelor Degree Holder Unemployment Rate is Half Of Overall US Unemployment Rate: Unlikely To See Labor Shortage Of College Educated
From BloombergBusiness, "Pretty Soon the U.S. Might Run Out of College-Educated Workers: The unemployment rate for bachelor's degree holders is at a six-year low" by Victoria Stilwell:
No Near Term Shortage Of College Educated Workers
Despite the sensational headline of the Bloomberg article mentioned above, there is not a present or near term need to worry about running out of bachelor degree holders for the workforce. As the chart from St. Louis Fed FRED data series shows below, the participation rate among bachelor degree holders in the labor force has been declining. There is an untapped reserve of college educated workers sitting on the sidelines.
From St. Louis Fed, Economic Data, FRED, "Civilian Labor Force Participation Rate - Bachelor's Degree and Higher, 25 years and over:"
Also, total job turnover, including the college educated, is about 3 and 1/3 percent of the workforce each month and the great majority of job hires are people who left other jobs, voluntarily and involuntarily. {See monthly BLS JOLTS Survey.) This job turnover results in increased productivity since workers move to positions where they are more needed or where they can get higher pay. Both are generally indicators of movement to a higher productivity position.
Businesses will also adapt job skill requirements to expectations of workforce costs and availability through increased investment in capital, automation, job training and simplifying job design to the skill levels available in the workforce.
Last month, the unemployment rate of workers who hold a bachelor's degree or higher sank to 2.8 percent, its lowest level since September 2008. That compares with a jobless rate of 5.7 percent for the overall population.
Source: BloombergBusiness

No Near Term Shortage Of College Educated Workers
Despite the sensational headline of the Bloomberg article mentioned above, there is not a present or near term need to worry about running out of bachelor degree holders for the workforce. As the chart from St. Louis Fed FRED data series shows below, the participation rate among bachelor degree holders in the labor force has been declining. There is an untapped reserve of college educated workers sitting on the sidelines.
From St. Louis Fed, Economic Data, FRED, "Civilian Labor Force Participation Rate - Bachelor's Degree and Higher, 25 years and over:"
 |
| Source: FRED, St. Louis Fed |
Also, total job turnover, including the college educated, is about 3 and 1/3 percent of the workforce each month and the great majority of job hires are people who left other jobs, voluntarily and involuntarily. {See monthly BLS JOLTS Survey.) This job turnover results in increased productivity since workers move to positions where they are more needed or where they can get higher pay. Both are generally indicators of movement to a higher productivity position.
Businesses will also adapt job skill requirements to expectations of workforce costs and availability through increased investment in capital, automation, job training and simplifying job design to the skill levels available in the workforce.
Thursday, February 5, 2015
US Economy Has Largest Increase In Hours Worked Since 1998, 4th Quarter
From Bureau of Labor Statistics, Economic News Release, "Productivity and Costs, Fourth Quarter and Annual Averages 2014, Preliminary:"
Nonfarm business sector labor productivity decreased at a 1.8 percent annual rate during the fourth quarter of 2014, the U.S. Bureau of Labor Statistics reported today, as output increased 3.2 percent and hours worked increased 5.1 percent. (All quarterly percent changes in this release are seasonally adjusted annual rates.) The increase in hours worked is the largest increase in this series since a gain of 5.7 percent in the fourth quarter of 1998. From the fourth quarter of 2013 to the fourth quarter of 2014, productivity was unchanged as output and hours worked both increased 3.1 percent. Annual average productivity increased 0.8 percent from 2013 to 2014. [Tables omitted. Emphasis added.]
Monday, February 2, 2015
Mortgage Debt To Income Ratios Did Not Increase During Housing Bubble And Bulk Of Mortgage Lending And Delinquencies Occurred Among Middle-Class And High-Income Borrowers And Not The Poor
The Washington Post, Opinions, "Robert Samuelson: Challenging what we know about the housing bubble" by Robert Samuelson:
Link to free download of pre-published version of the research paper.
Now comes a study that rejects or qualifies much of this received wisdom [about the housing bubble and collapse]. Conducted by economists Manuel Adelino of Duke University, Antoinette Schoar of the Massachusetts Institute of Technology and Felipe Severino of Dartmouth College, the study — recently published by the National Bureau of Economic Research — reached three central conclusions.Link to free abstract and gated NBER paper, "Changes in Buyer Composition and the Expansion of Credit During the Boom" by Manuel Adelino, Antoinette Schoar and Felipe Severino, NBER Working Paper No. 20848, Issued in January 2015.
First, mortgage lending wasn’t aimed mainly at the poor. Earlier research studied lending by Zip codes and found sharp growth in poorer neighborhoods. Borrowers were assumed to reflect the average characteristics of residents in these neighborhoods. But the new study examined the actual borrowers and found this wasn’t true. They were much richer than average residents. In 2002, home buyers in these poor neighborhoods had average incomes of $63,000, double the neighborhoods’ average of $31,000.
Second, borrowers were not saddled with progressively larger mortgage debt burdens. One way of measuring this is the debt-to-income ratio: Someone with a $100,000 mortgage and $50,000 of income has a debt-to-income ratio of 2. In 2002, the mortgage-debt-to-income ratio of the poorest borrowers was 2; in 2006, it was still 2. Ratios for wealthier borrowers also remained stable during the housing boom. The essence of the boom was not that typical debt burdens shot through the roof; it was that more and more people were borrowing.
Third, the bulk of mortgage lending and losses — measured by dollar volume — occurred among middle-class and high-income borrowers. In 2006, the wealthiest 40 percent of borrowers represented 55 percent of new loans and nearly 60 percent of delinquencies (defined as payments at least 90 days overdue) in the next three years.
Link to free download of pre-published version of the research paper.
Subscribe to:
Posts (Atom)