Instead of paying for shorter delays, a better option is to fix the structure that causes delays. That means decentralizing the VA and selling off most of the institution. There is no medical or biological reason that former soldiers require special hospitals for routine treatments or even most complex conditions. The VA can prioritize specialized care for combat trauma and rehabilitation unique to military service, insurance vouchers for vets can replace socialized medicine, and markets will discipline a now-unaccountable bureaucratic culture.
Such a privatization is unlikely given the political sensitivities, the power of veterans interest groups and the fact that liberals consider the VA a health-care model. But perhaps if Congress thinks more creatively than usual, the outcome will be better than another cosmetic VA renovation that guarantees disgraces for the next Administration.
Saturday, May 31, 2014
Decentralize The VA And Use Insurance Vouchers To Vets For Private Medical Care
From The Wall Street Journal, Opinion, "Real Accountability at the VA: Shinseki's resignation would be a terrible thing to waste:"
Friday, May 30, 2014
US Businesses Produced 42 Percent More In 2013 Using The Same Amount Of Labor As In 1998
From The Bureau of Labor Statistics, Beyond the Numbers, "What can labor productivity tell us about the U.S. economy?" by Shawn Sprague:
This fact might strike some as surprising: workers in the U.S. business sector worked virtually the same number of hours in 2013 as they had in 1998—approximately 194 billion labor hours. What this means is that there was ultimately no growth at all in the number of hours worked over this 15-year period, despite the fact that the U.S population gained over 40 million people during that time, and despite the fact that there were thousands of new businesses established during that time.
And given this lack of growth in labor hours, it is perhaps even more striking that American businesses still managed to produce 42 percent—or $3.5 trillion—more output in 2013 than they had in 1998, even after adjusting for inflation.
Friday, May 23, 2014
Huge Drop In Odds Favoring Republican Control Of House And Senate
On April 16, 2014, the price of the Iowa Electronic Market Security for a Republican House and a Republican Senate was .566, or a 56.6 percent chance that the Republicans would control Congress after the 2014 election. The current price is .275, or a 27.5 percent chance.
The odds favoring a Republican controlled Congress after the 2014 Congressional election have declined to less than half of what the odds were a month ago. The red line in the chart represents the price and odds of a Republican controlled House and Senate.
Congress14
2014 US Congressional Control Market
Source: Iowa Electronic Market
The odds favoring a Republican controlled Congress after the 2014 Congressional election have declined to less than half of what the odds were a month ago. The red line in the chart represents the price and odds of a Republican controlled House and Senate.
2014 US Congressional Control Market
 |
| Source: Iowa Electronic Markets |
Market Quotes: Congress14 2014 Congressional Control Market.
Quotes current as of 20:30:02 CST, Friday, May 23, 2014.
| Symbol | Bid | Ask | Last | Low | High | Average |
| DH_DS14 | 0.035 | 0.049 | 0.022 | 0.021 | 0.060 | 0.029 |
| DH_RS14 | 0.007 | 0.008 | 0.007 | 0.007 | 0.007 | 0.007 |
| RH_DS14 | 0.337 | 0.492 | 0.490 | 0.490 | 0.490 | 0.490 |
| RH_RS14 | 0.275 | 0.437 | 0.275 | 0.275 | 0.330 | 0.307 |
| OTHER14 | 0.201 | 0.225 | 0.207 | 0.160 | 0.207 | 0.186 |
Thursday, May 22, 2014
Emergency Room Visits Up Under Affordable Care Act
From The Wall Street Journal, "ER Visits Rise Despite Law: Health Act Isn't Cutting Emergency Volume So Far; Government Says It's Too Early to Draw Conclusions" by Stephanie Armour and Louise Radnofsky:
Early evidence suggests that emergency rooms have become busier since the Affordable Care Act expanded insurance coverage this year, despite the law's goal of reducing unnecessary care in ERs.
Almost half of ER doctors say they are seeing more patients since key provisions of the health law took effect Jan. 1, while more than a quarter say their patient volume has remained the same, according to a survey to be released Wednesday by the American College of Emergency Physicians.
*** Democrats who designed the 2010 health law hoped it would do the opposite.
 |
| Source: The Wall Street Journal |
Wednesday, May 21, 2014
Housing Market More Unsound Today Than Before The Financial Crisis: Larry Fink
From Bloomberg, "BlackRock’s Fink Says Housing Structure More Unsound Now" by Christopher Condon and Mary Childs:
BlackRock Inc. (BLK)’s Chief Executive Officer Laurence D. Fink said the U.S. housing market is “structurally more unsound” today than before the financial crisis because it depends more on government-backed mortgage companies such as Fannie Mae and Freddie Mac.
"We’re more dependent on Fannie and Freddie than we were before the crisis," Fink said today at a conference held by the Investment Company Institute in Washington, noting that he was one of the first Freddie Mac bond traders on Wall Street.
Saturday, May 17, 2014
Chart Of How Rich And Poor Spend Their Money
From Bloomberg, "Where Our Money Goes, Rich and Poor" by Kirsten Salyer:
Slide 19
Click chart to enlarge.
Slide 19
 |
| Source : Bloomberg |
Click chart to enlarge.
Election Markets Predict Neither Democrats Nor Republicans Will Control US Senate After 2014 Election
There is a 22.5 percent chance that enough Independent or other Third Party candidates will get elected to Congress in 2014 to prevent Republicans from gaining control of both Houses of Congress. The current odds widely favor the Republicans holding onto a majority in the House.
The Iowa Electronic Market is trading election securities for control of Congress. The Iowa Electronics Market election securities are currently showing a an 8.3 percent chance that the Republicans will lose control of the House. The election securities are showing a 60.5 percent chance that the Democrats will lose control of the Senate.
Market Quotes: House14
Quotes current as of 01:45:03 CST, Saturday, May 17, 2014.
Market Quotes: Senate14
In addition to the four securities for the likely combinations of House-Senate combinations, Democrat-Democrat, Democrat-Republican, Republican-Democrat, and Republican-Republican, the market also trades an OTHER security that reflects neither of the 4 previous listed obvious combinations. The current price of the OTHER election security is 22.5. On April 22, 2014, the price was 8.1 and has been rising since.
Market Quotes: Congress14
Quotes current as of 01:45:03 CST, Saturday, May 17, 2014.
With the low probability that the Republicans will lose House control, the likely scenario for the OTHER security is that the Republicans maintain control of the House but neither the Democrats nor Republican have control of the Senate after the 2014 Congressional election. This scenario can happen if enough Independent or Third Party candidates are elected to the US Senate to prevent either of the two major political parties, Democrats and Republicans, from having control of the Senate. The election security markets are giving the OTHER option a 22.5 percent chance of happening.
The Iowa Electronic Market is trading election securities for control of Congress. The Iowa Electronics Market election securities are currently showing a an 8.3 percent chance that the Republicans will lose control of the House. The election securities are showing a 60.5 percent chance that the Democrats will lose control of the Senate.
Market Quotes: House14
2014 House Control Market.
Quotes current as of 01:45:03 CST, Saturday, May 17, 2014.| Symbol | Bid | Ask | Last | Low | High | Average |
| RH.gain14 | 0.421 | 0.499 | 0.470 | --- | --- | --- |
| RH.hold14 | 0.430 | 0.469 | 0.469 | --- | --- | --- |
| RH.lose14 | 0.062 | 0.085 | 0.083 | --- | --- | --- |
Market Quotes: Senate14
2014 Senate Control Market.
Quotes current as of 01:45:03 CST, Saturday, May 17, 2014.
| Symbol | Bid | Ask | Last | Low | High | Average |
| DS.gain14 | 0.018 | 0.029 | 0.018 | --- | --- | --- |
| DS.hold14 | 0.378 | 0.399 | 0.393 | --- | --- | --- |
| DS.lose14 | 0.589 | 0.606 | 0.605 | --- | --- | --- |
Market Quotes: Congress14
2014 Congressional Control Market.
Quotes current as of 01:45:03 CST, Saturday, May 17, 2014.| Symbol | Bid | Ask | Last | Low | High | Average |
| DH_DS14 | 0.052 | 0.069 | 0.069 | --- | --- | --- |
| DH_RS14 | 0.007 | 0.008 | 0.007 | --- | --- | --- |
| RH_DS14 | 0.265 | 0.298 | 0.290 | --- | --- | --- |
| RH_RS14 | 0.354 | 0.449 | 0.426 | --- | --- | --- |
| OTHER14 | 0.225 | 0.250 | 0.225 | --- | --- | --- |
With the low probability that the Republicans will lose House control, the likely scenario for the OTHER security is that the Republicans maintain control of the House but neither the Democrats nor Republican have control of the Senate after the 2014 Congressional election. This scenario can happen if enough Independent or Third Party candidates are elected to the US Senate to prevent either of the two major political parties, Democrats and Republicans, from having control of the Senate. The election security markets are giving the OTHER option a 22.5 percent chance of happening.
Disposable Income Has Increased Across All Income Groups Since 1979
From The Wall Street Journal, "The Denial of Middle-Class Prosperity: Government data show that average disposable income has increased across all income groups since 1979." by Neil Gilbert:
The problem with the research showing middle-class stagnation is that it looks at market incomes, which exclude taxes, government transfers and adjustments for household size.*** The Congressional Budget Office's 2011 report on income inequality trends offers a more precise accounting, dispelling the notion that the past three decades have been characterized by the rich getting richer at the expense of the poor while the middle class stays about the same. The CBO adjusts market income by subtracting taxes and adding the cash value of social benefits. When households are then divided into five equal income groups, the data reveal that average disposable household income has increased across all groups since 1979. The average household income grew by 40% for the middle quintile and increased by 49% for the bottom quintile.*** The average U.S. family has 38% more disposable income than a family in Italy, 25% more than a family in France and 20% more than a household in Germany, when adjusted for purchasing power, according to the Organization for Economic Cooperation and Development. Inequality in the U.S. is not a struggle between the "haves" and the "have-nots," but a social friction between those who have a lot and others who have more.
New York State Has The Highest Rate Of Black Students In High-Minority Schools And The Lowest Rate Of Exposure To White Students
From The Washington Post, "The most segregated schools may not be in the states you’d expect" by Niraj Chokshi:
Black students are most segregated in the Northeast
The Northeast was the only region where, on average, the share of black students in almost completely minority schools has risen since 1968, according to the report titled "Brown at 60: Great Progress, a Long Retreat and an Uncertain Future." More than half — 51.4 percent — of black students in those states in 2011 were in schools whose student populations were 90 percent to 100 percent minorities. In every other region of the country — the Midwest, West, South and “border” states — black students today are less likely to be in heavily minority schools.
[Chart omitted.]
New York is one of the most segregated states for black students. It has the highest rate of black students in high-minority schools and the lowest rate of black exposure to white students. Illinois is second on both measures. Maryland is third when it comes to the share of black students in high-minority schools and fourth-lowest when it comes to black exposure to white students. California, Michigan, New Jersey and Texas also rank highly among the indicators suggesting high rates of segregation among blacks.
West Virginia is the most integrated state across the board. The share of black students in majority-white schools is incredibly high — 92.6 percent. No black students attend schools where the minority population is above 90 percent and exposure of black students to white students is the highest in the nation. Iowa and Kentucky battle it out for the number two spot among the three measures. Kansas, Minnesota and Nebraska also rank among the most integrated states for blacks.
Thursday, May 15, 2014
The Systemic Risk Of Tim Geithner's And The Federal Reserve's Inconsistent Bailout Strategy During The Financial Crisis
From Bloomberg, "Geithner Still Can't Explain Lehman" by Mark Gilbert:
One of the most puzzling aspects of the financial crisis was the zig-zag-zig by the U.S. authorities, who saved Bear Stearns from bankruptcy, then let Lehman Brothers fall off the cliff only to rescue AIG a day later.
Geithner, who was at the helm of the New York Federal Reserve during the meltdown and then became President Barack Obama's Treasury secretary in its aftermath, has no time for "moral hazard fundamentalists" who object to bailouts for banks. "The truly moral thing to do during a raging financial inferno is to put it out," he argues. So why didn't he throw buckets of dollars on Lehman when it was blazing away?*** Bear Stearns should have been allowed to go bust, economic Darwinism would have cleansed the system, and the world of finance would have taken a beating but emerged stronger for it. Instead, other bankers and other firms -- notably Dick Fuld at Lehman Brothers -- took the rescue as evidence that the Fed safety net would also be extended in their hour of need. Geithner acknowledges this, but reaches a different conclusion.*** So because the collapse of Bear Stearns was a surprise and there was a willing buyer, Geithner was willing to pledge taxpayer money to get a deal done. But because Lehman was unloved and unwanted by its peers, Geithner felt he couldn't act.
That would make some kind of sense, I guess, if it wasn't for what happened a day after Lehman collapsed when the holes in AIG's balance sheet came to light. Geithner instantly found $85 billion to patch it up.*** Either Bear Stearns should have been allowed to go bust, or Lehman should have been propped up. To me, Geithner's inconsistency still seems crazy after all these years.
Two Times As Many Medicaid Patients Die Within A Month Of Surgery As Privately Insured Patients
From MedlinePlus, "Surgical Outcomes Worse for People on Medicaid: Study: Chronic health conditions, high smoking rates, need for emergency surgeries some possible reasons why" by Robert Preidt:
Compared to patients with private insurance, those covered by Medicaid were more than twice as likely to die within a month of surgery. They also had many more emergency operations and two-thirds more complications after surgery, the study found. Those on Medicaid used 50 percent more hospital resources, had longer hospital stays and ended up back in the hospital more often than those with private insurance.*** The findings, published online May 12 in the journal JAMA Surgery, are important because millions of uninsured people will become eligible to enroll in Medicaid programs that 26 states have expanded under the Affordable Care Act, the University of Michigan Medical School researchers said.
The US Inequality Problem Is Not High Income Earners: The US Inequality Problem Is The Persistence Of Poverty
From The Wall Street Journal, Opinion, "Piketty's Numbers Don't Add Up: Ignoring dramatic changes in tax rules since 1980 creates the false impression that income inequality is rising." by Martin Feldstein:
For example, tax law changes caused business owners to shift income from taxable corporations (Subchapter C) to Subchapter S corporations. Subchapter S corporate income is included in an individual's personal tax return and not in a separate taxable corporation tax return. The shift increased the income shown on personal tax returns, used by Piketty for his conclusions, but the shift did not increase the total income of the business owners who had previously filed separate business tax returns. The shifting of the income to the personal return led Piketty to conclude that there was a much bigger increase in income of the wealthy than there was.
Likewise, a lowering of tax rates caused a shift from tax free municipal bonds into investments paying taxable dividends. The change in investments did not increase total investment income, but it did increase the taxable income on personal tax returns analyzed by Piketty.
His [Thomas Piketty's] conclusion about ever-increasing inequality could be correct if people lived forever. But they don't. Individuals save during their working years and spend most of their accumulated assets during retirement. They pass on some of their wealth to the next generation. But the cumulative effect of such bequests is diluted by the combination of existing estate taxes and the number of children and grandchildren who share the bequests.Please read the entire article for Feldstein's critique of Piketty's analysis of tax return data. Feldstein discusses how the changes in the tax law and rules affected the income shown on personal tax returns and how Piketty misinterpreted tax law changes for economic changes that made the wealthy wealthier.
The result is that total wealth grows over time roughly in proportion to total income. Since 1960, the Federal Reserve flow-of-funds data report that real total household wealth in the U.S. has grown at 3.2% a year while the real total personal income calculated by the Department of Commerce grew at 3.3%.*** The problem with the distribution of income in this country is not that some people earn high incomes because of skill, training or luck. The problem is the persistence of poverty. To reduce that persistent poverty we need stronger economic growth and a different approach to education and training, not the confiscatory taxes on income and wealth that Mr. Piketty recommends.
Mr. Feldstein, chairman of the Council of Economic Advisers under President Ronald Reagan, is a professor at Harvard and a member of the Journal's board of contributors.
For example, tax law changes caused business owners to shift income from taxable corporations (Subchapter C) to Subchapter S corporations. Subchapter S corporate income is included in an individual's personal tax return and not in a separate taxable corporation tax return. The shift increased the income shown on personal tax returns, used by Piketty for his conclusions, but the shift did not increase the total income of the business owners who had previously filed separate business tax returns. The shifting of the income to the personal return led Piketty to conclude that there was a much bigger increase in income of the wealthy than there was.
Likewise, a lowering of tax rates caused a shift from tax free municipal bonds into investments paying taxable dividends. The change in investments did not increase total investment income, but it did increase the taxable income on personal tax returns analyzed by Piketty.
Wednesday, May 14, 2014
CBO Projects Federal Debt On Unsustainable Path: Government Debt To Increase To Much Larger Share Of GDP: Rising Cost Of Health Care A Significant Contributor
From Congressional Budget Office, Presentation by Doug Elmendorf, CBO Director, to the Stanford Institute for Economic Policy Research, May 14, 2014, "Shifting Priorities in the Federal Budget:"
Under current law, the future of the federal budget will
be strikingly different from its past in two key ways:
Federal debt will be much larger relative to the size of
the economy than it has been in almost all of our
history.
A much larger share of federal spending will go to
benefits for older Americans and for health care, and a
much smaller share will go to other activities.*** The largest federal programs are becoming much more
expensive because of the retirement of the baby boomers
and the rising costs of health care. As a result, even with
federal spending for all programs other than Social Security
and the major health care programs on track to reach its
smallest share of GDP in at least 70 years, federal debt
remains on an unsustainable path. [Emphasis added.]
Tuesday, May 13, 2014
Study Finds Cervical Cancer Rate For Women 65 To 69 Years Old Is 84 Percent Higher Than Previously Thought
From MedlinePlus, "U.S. Cervical Cancer Rates Higher Than Thought: Rates highest in women 65 to 69, and black women, say researchers using revised data" by Robert Preidt:
Previous studies had estimated that the U.S. cervical cancer rate was about 12 cases per 100,000 women, that the highest rates were in women between ages 40 and 44 and that they then leveled off.
But those estimates included women who had hysterectomies, in which the cervix was removed. For the new study, researchers excluded this group of women, because they were no longer at risk, and then concluded that the overall rate of cervical cancer was 18.6 cases per 100,000 women. They also found that the incidence rose steadily with age and peaked at ages 65 to 69.
The incidence of cervical cancer among women ages 65 to 69 was 84 percent higher than previously reported, according to the study, published online May 12 in the journal Cancer.
Food Stamp (SNAP) Enrollment Declining
From The Wall Street Journal, Washington Wire, "Drop in Food Stamp Enrollment Picks Up Steam" by Damian Paletta and Josh Zumbrun:
 ENROLLMENT CHART") |
| Source: The Wall Street Journal |
The number of Americans receiving food stamps is now falling at a faster clip, with more than 1.2 million people moving out of the program between October and February, according to federal data.
As of February, the most recent data available, 46.2 million Americans received Supplemental Nutrition Assistance Program benefits. That’s the lowest level since August 2011 and down from the March 2013 peak of 47.7 million people. The $5.8 billion in benefits paid out in February was the lowest level since at least 2010.
Monday, May 12, 2014
New York Has More Unused And Decaying Shopping Malls Than Any Other State
From Chappaqua-Mount Kisco Patch, "Dead Malls: New York Has Most in Nation: The Golden Age of the American shopping mall is over and the shopping landscape has changed. Or has it?" by Ryan Bonner:
They're a blight on America’s suburban landscape: hulking dead shopping malls, many with boarded windows, sagging rooftops and parking lots full of weeds.*** The website DeadMalls.com maintains a state-by-state list [http://deadmalls.com/stories.html] of America’s forlorn shopping meccas. With 42, according to the site, New York has more "dead malls" than any other state.
Saturday, May 10, 2014
Increasing Share Of Older Autos On The Road
From US Bureau of Labor Statistics, Beyond The Numbers, "Americans’ aging autos" by Ryan Pfirrmann-Powell:
The average age of households’ cars, vans, sport utility vehicles (SUVs), and trucks increased from 10.1 years in 2007 to just over 11.3 years in 2012. Chart 2 shows that the share of newer vehicles (those manufactured less than 5 years earlier than the year shown) dropped by nearly 33 percent from 2007 to 2012 while the share of vehicles 11–20 years old grew by 25 percent over the same timeframe.
 |
| Source: US Bureau Of Labor Statistics |
US States Map Of Average Student Loan Debt
From The Washington Post, GovBeat, "Map: Where the average student loan burden is largest" by Niraj Chokshi:
***
 |
| Source: The Washington Post |
The graduates will have an average of $26,500 in student loans, joining the tens of millions of other adults who collectively hold more than $1 trillion in student loan debt. That burden is largest, on average, in many Northeastern and Mid-Atlantic states, a few Southeastern states and California. Some of those states—especially in the Northeast and Mid-Atlantic....
Tuesday, May 6, 2014
20 To 39 year Olds Have Highest 401(k) Cash-Out Rates
From Bloomberg, "Early Tap of 401(k) Replaces Homes as American Piggy Bank" by Richard Rubin and Margaret Collins:
Younger workers ages 20 to 39 have the highest cash-out rates, with about 40 percent taking money with them when they switch jobs, according to data from Fidelity, the largest administrator of 401(k) plans.
"The pervasive thinking is, 'Why bother rolling over $2,500? The taxes and penalties aren’t that daunting,'" said Michael Branham, a financial planner at Cornerstone Wealth Advisors in Edina, Minnesota. "What’s missing is the longer-term thinking in that decision-making process."
Zero Dollar Minimum Wage
From The Wall Street Journal, Opinion, "Then There's the Real Minimum Wage: Zero: Small business owners don't plan all those hours for little pay. Sometimes it just works out that way." by John H Heyer:
Amid all the national discussion about raising the minimum wage, it's easy to forget that there are thousands, if not millions, of Americans who work for less than the minimum wage—some even for negative wages (imagine that). Principal among these less-than-the-minimum are self-employed workers, tradesmen and women and small business owners, especially those starting new businesses.*** After covering overhead, including minimum wage for their employees, small business owners may end up losing money—i.e., making negative income. How much is that per hour?*** The largest category of zero-salaried workers are the millions who volunteer their services and expertise for nonprofit organizations—churches, YMCAs, schools, hospitals, kids' sports leagues, recreation programs; the list is endless. So it's OK for them to work for $0 per hour, or for the minimum wage, but illegal for anything in between. Does that make sense? If they can agree to work for $0 per hour, why not for $1 or $5 or any other number agreed to? [Emphasis added.]
Shortfall At Highway Trust Fund Will Delay 2014 Payments To States: 2015 Funds Will Be Needed to Pay 2014 Obligations: CBO Testimony
From CBO, "Testimony on the Status of the Highway Trust Fund and Options for Financing Highway Spending" by Joseph Kile, Assistant Director for Microeconomic Studies, before the Committee on Finance, United State Senate, May 6, 2014:
Moreover, with its current revenue sources, the Highway Trust Fund cannot support spending at the current rate. The Congressional Budget Office (CBO) estimates that, at the end of fiscal year 2014, the balance in the trust fund’s highway account will fall to about $2 billion and the balance in its transit account will be only $1 billion. Spending for highways and transit will be $45 billion and $8 billion, respectively. By comparison, revenues collected for those purposes are projected to be $33 billion and $5 billion, respectively. The Department of Transportation (DOT) has indicated that it will probably need to delay payments to states at some point during the summer of 2014 in order to keep the fund’s balance above zero, as required by law. Then, if nothing changes, the trust fund’s balance will be insufficient to meet all of its obligations in fiscal year 2015, and it will incur steadily accumulating shortfalls in subsequent years. If lawmakers do not take action, all of the receipts credited to the fund in 2015 would be needed to meet obligations made before that year; none would be available to cover any new commitments that would be made in 2015.
Sunday, May 4, 2014
NYC Liberals Talk The Talk But Don't Walk The Walk
From The New York Times, NY Region, "Exposing the Hypocrisies of the New York Liberal" by Ginia Bellafante:
Today we find ourselves in the midst of a different, inverted paradox, one that makes it possible for whole news cycles to be given over to the luridly disgraceful words of someone like Donald Sterling while we are able comparatively to ignore a study like the one released in March, from U.C.L.A.’s Civil Rights Project, ranking New York as the state with the country’s most segregated schools. Greatly affecting that ranking, the study pointed out, were the demographics of public education in New York City where, despite the primacy of liberal values, the percentage of schools in which at least nine-tenths of the students were black or Hispanic rose sharply from 1989 to 2010.*** Beyond language, there are other necessary avenues for progressives’ self-examination. On April 30, James Parrott, chief economist of the Fiscal Policy Institute, testified before a City Council committee on the need for the city to be able to set its own minimum wage. Among the statistics he provided: While half of all workers in retail, leisure and hospitality are low-wage, the largest sector employing that cohort in New York City is the nonprofit world, specifically, he said, in education, health and social services. One in four low-wage workers is employed by this sector, whose agencies are often under contract with the city to provide child care services, youth programs and so on. Among social assistance sector workers, 42 percent make less than $14 an hour, while a quarter make less than $10. Sometimes benevolence must begin with your own bookkeeping.
Saturday, May 3, 2014
Increasing Share Of New Retirement Funds Going Into Stocks
From The Wall Street Journal, "Retirement Investors Flock Back to Stocks :Equities Account for Highest Percentage of New Contributions Into 401(k) Plans Since Crisis" by Joe Light:
Retirement investors are putting more money into stocks than they have since markets were slammed by the financial crisis six years ago.
Stocks accounted for 67% of employees' new contributions into retirement portfolios in March, according to the most-recent data from Aon Hewitt, which tracks 401(k) data for 1.3 million people at large corporations.
 |
| Source: The Wall Street Journal |
 |
| Source: The Wall Street Journal |
Friday, May 2, 2014
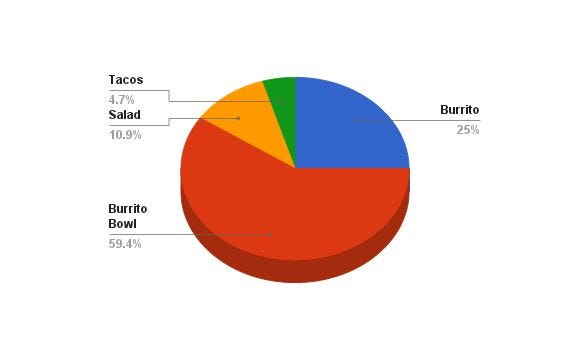
What People Order At Chipotle: Non-Scientific Survey
From The Awl, "The Twilight Of The Tortilla: What People Really Order At Chipotle" by Bobby Finger:
Last week, I sent a Chipotle survey to 100 people. 64 of them responded. This is what they shared.
*** What form does your Chipotle order take?
***
 |
| Source: The Awl |
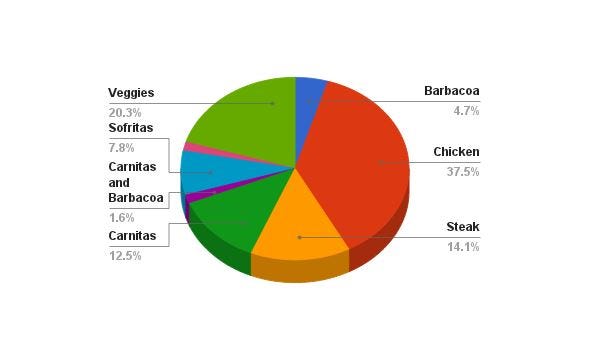
Main ingredient?
***
Source: The Awl
By 2060, US Census Bureau Expects The Latino Population In The US To Grow From 17 Percent To 31 Percent Of The US Population
From PewResearch, "Hispanic Nativity Shift: U.S. births drive population growth as immigration stalls" by Jens Manuel Krogstad and Mark Hugo Lopez:
Since 2000, the U.S.-born Latino population continued to grow at a faster rate than the immigrant population. As a result, the foreign-born share of Latinos is now in decline.
Among Hispanic adults in 2012, 49.8% were born in another country, down from a peak of 55% in 2007. Among all Hispanics, the share foreign-born was 35.5% in 2012, down from about 40% earlier in the 2000s.*** Even as the share of Latino immigrants decreases, rapid growth in the number of Latino births means the Latino population will continue to grow at a steady clip. Latinos are the nation’s largest minority, and one of its fastest growing. Since 1970, the Latino population has increased sixfold, from 9.1 million to 53 million by 2012. It is projected to grow to 129 million by 2060, according to the latest projections from the U.S. Census Bureau (2012). Its share of the U.S. population, currently at 17%, is expected to reach 31% by 2060.
Thursday, May 1, 2014
Survey Panel Data Suggests Raising Inflation Expectations Not Effective In Boosting Consumption
From Federal Reserve Bank Of Boston, Working Paper No. 13-25, "Household Inflation Expectations and Consumer Spending: Evidence from Panel Data" by Mary A. Burke and Ali Ozdagli:
With nominal interest rates at the zero lower bound, an important question for monetary policy is whether, as predicted in prior theoretical work, an increase in inflation expectations would boost current consumer spending. Using survey panel data for the period from April 2009 to November 2012, we examine the relationship between a household's inflation expectations and its current spending, taking into account other factors such as the household's wage growth expectations, the uncertainty surrounding its inflation expectations, macroeconomic conditions, and unobserved heterogeneity at the household level. We examine spending behavior for large consumer durables as well as for nondurable goods. No evidence is found that consumers increase their spending on large home appliances and electronics in response to an increase in their inflation expectations.PDF copy of paper.*** These findings are surprising because theory predicts that consumption of durable goods should be more sensitive to real interest rates than consumption of nondurable goods. In addition, consumers in our sample, on average, did not expect their nominal income growth to match inflation, and therefore an increase in expected inflation would create a negative income effect that discourages spending in both the present and the future. The findings suggest that, as a policy measure, raising inflation expectations may not be effective in boosting present consumption. [Emphasis added.]
Study Suggests Almost Half Of The Homeless Have Prior Brain Injuries
From MedlinePlus, "Traumatic Brain Injury Common Among Homeless Men: In small Canadian study, 70 percent of such injuries occurred during childhood or teen years" by Robert Preidt:
Brain injuries are common among homeless men and most of those injuries occur before they lose their homes, a small study found.
Canadian researchers looked at 111 homeless men, aged 27 to 81, in Toronto and found that 45 percent of them had suffered a traumatic brain injury at some point in their lives.
Seventy percent of those brain injuries occurred when the men were children or teens, and 87 percent occurred before the men became homeless, the investigators found.
Overall, assaults caused 60 percent of the brain injuries among the men in the study, followed by sports and recreation (44 percent), and traffic crashes and falls (42 percent), according to the study published April 25 in the journal CMAJ Open.
While assaults were the most common cause of brain injury among men older than 40, falls from drug/alcohol blackouts were the most common cause of brain injury in those under 40, the findings showed.
Obese With Normal Blood Pressure, Cholesterol And Blood Sugar Levels At Greater Risk Than Non-Obese For Heart Disease And Stroke
From MedlinePlus, "Is Healthy Obesity a Myth? Study found even with normal blood pressure, cholesterol and blood sugar levels, the obese had more artery plaque:"
Can someone be obese and healthy? A new study and several experts say no.
An obese person who has normal blood pressure, normal cholesterol and normal blood sugar levels is still at risk for heart disease, Korean researchers report in the April 30 online edition of the Journal of the American College of Cardiology.
In the study of more than 14,000 men and women, aged 30 to 59, those who were obese had more plaque buildup in their arteries, putting them at greater risk for heart disease and stroke than people of normal weight, the researchers found.

Subscribe to:
Posts (Atom)